. 1999 Jan 15;514 ( Pt 2)(Pt 2):351-67.
doi: 10.1111/j.1469-7793.1999.351ae.x.

Evidence that multiple P2X purinoceptors are functionally expressed in rat supraoptic neurones

Affiliations

Evidence that multiple P2X purinoceptors are functionally expressed in rat supraoptic neurones

I Shibuya et al. J Physiol. .

Abstract

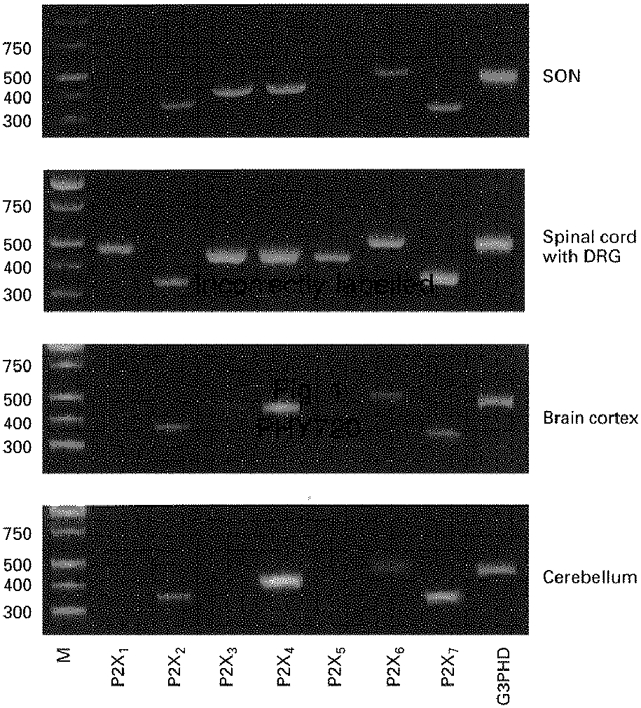
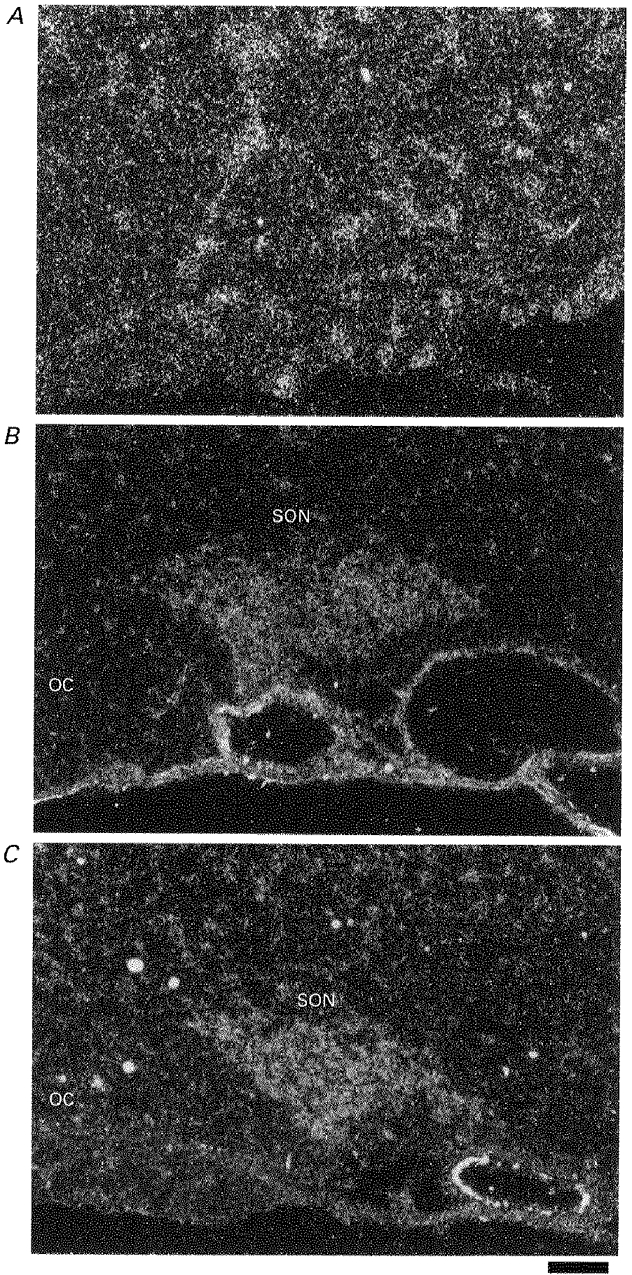
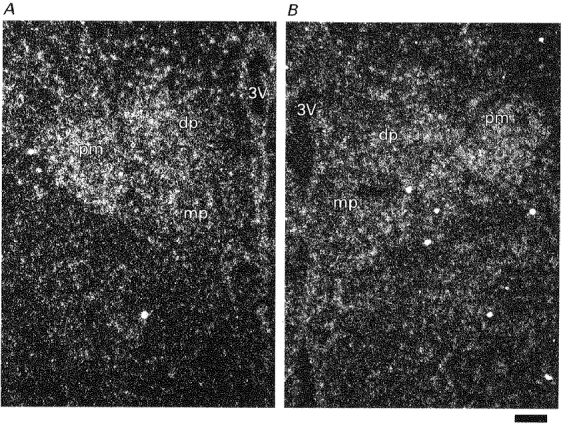
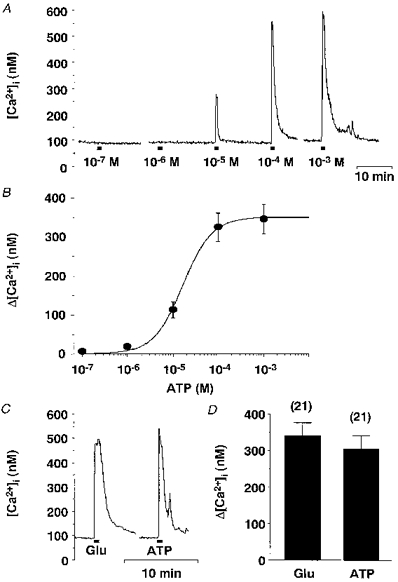
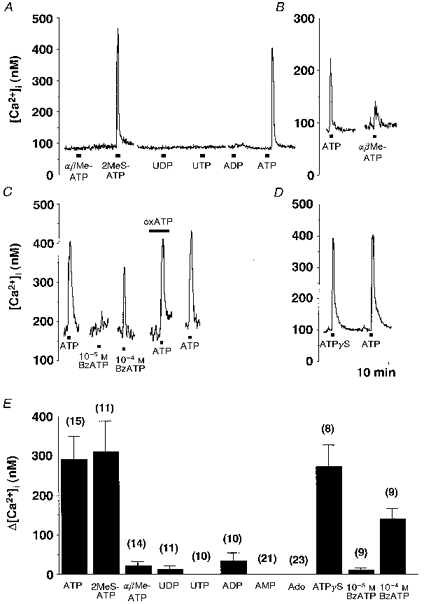
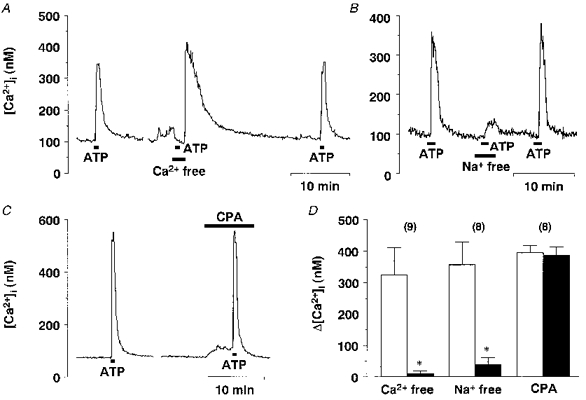
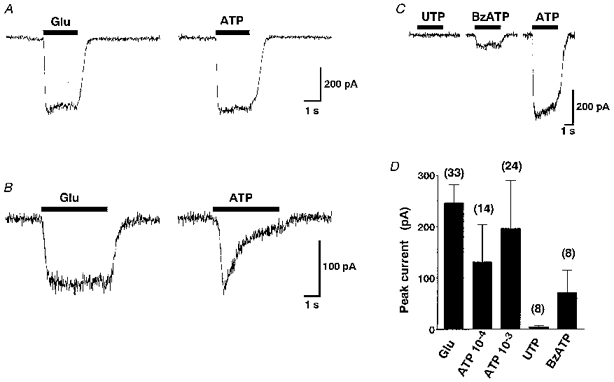
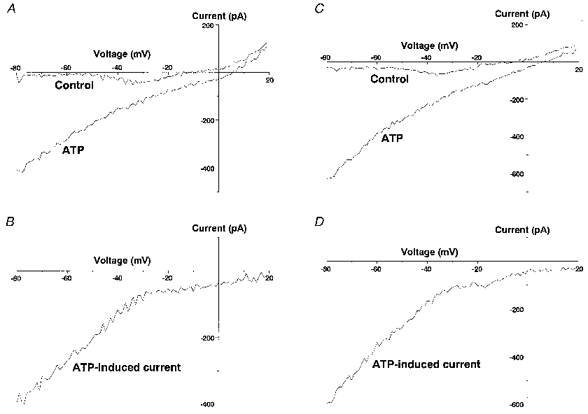
1. The expression, distribution and function of P2X purinoceptors in the supraoptic nucleus (SON) were investigated by reverse transcription-polymerase chain reaction (RT-PCR), in situ hybridization, and Ca2+-imaging and whole-cell patch-clamp techniques, respectively. 2. RT-PCR analysis of all seven known P2X receptor mRNAs in circular punches of the SON revealed that mRNAs for P2X2, P2X3, P2X4, P2X6 and P2X7 receptors were expressed in the SON, and mRNAs for P2X3, P2X4 and P2X7 were predominant. 3. In situ hybridization histochemistry for P2X3 and P2X4 receptor mRNAs showed that both mRNAs were expressed throughout the SON and in the paraventricular nucleus (PVN). 4. ATP caused an increase in [Ca2+]i in a dose-dependent manner with an ED50 of 1.7 x 10⁻⁵ M. The effects of ATP were mimicked by ATPgammaS and 2-methylthio ATP (2MeSATP), but not by AMP, adenosine, UTP or UDP. alphabeta-Methylene ATP (alphabetaMeATP) and ADP caused a small increase in [Ca2+]i in a subset of SON neurones. 5. The P2X7 agonist 2'- & 3'-O-(4-benzoylbenzoyl)-ATP (BzATP) at 10-4 M increased [Ca2+]i, but the potency of BzATP was lower than that of ATP. In contrast, BzATP caused a more prominent [Ca2+]i increase than ATP in non-neuronal cells in the SON. 6. The effects of ATP were abolished by extracellular Ca2+ removal or by the P2 antagonist pyridoxal phosphate-6-azophenyl-2',4'-disulphonic acid (PPADS), and inhibited by extracellular Na+ replacement or another P2 antagonist, suramin, but were unaffected by the P2X7 antagonist oxidized ATP, and the inhibitor of Ca2+-ATPase in intracellular Ca2+ stores cyclopiazonic acid. 7. Two patterns of desensitization were observed in the [Ca2+]i response to repeated applications of ATP: some neurones showed little or moderate desensitization, while others showed strong desensitization. 8. Whole-cell patch-clamp analysis showed that ATP induced cationic currents with marked inward rectification. The ATP-induced currents exhibited two patterns of desensitization similar to those observed in the [Ca2+]i response. 9. The results suggest that multiple P2X receptors, including P2X3, are functionally expressed in SON neurones, and that activation of these receptors induces cationic currents and Ca2+ entry. Such ionic and Ca2+-signalling mechanisms triggered by ATP may play an important role in the regulation of SON neurosecretory cells.


Figures

Figure 1
Figure 1. RT-PCR analysis of P2X purinoceptor mRNAs expressed in the SON, the spinal cord with dorsal root ganglion, the brain cortex and the cerebellum
The total RNAs from the SON, brain cortex, spinal cord with dorsal root ganglion (DRG), and cerebellum were reverse transcribed, and amplified by PCR with each primer pair described in Table 1. Primers for a house-keeping gene, glyceraldehyde 3-phosphate dehydrogenase (G3PDH), were used as an internal standard and generated a 450 bp fragment. Amplification products were electrophoresed on 2% agarose gel and visualized by ethidium bromide staining. Lane M, DNA marker. When PCR was performed with each sample without prior reverse transcription, there was no amplification product, indicating that the bands appearing on the gels were not derived from genomic DNA.
Figure 2
Figure 2. In situ hybridization histochemistry for P2X3 and P2X4 receptor mRNAs in the SON
Dark-field photomicrographs of emulsion-dipped slides hybridized with 35S-labelled riboprobes complementary to P2X3 (A and B) and P2X4 (C) mRNA. A, section from rat trigeminal ganglion. B and C, sections from the rat hypothalamus. OC, optic chiasma. Scale bar is 50 μm.
Figure 3
Figure 3. In situ hybridization histochemistry for P2X3 and P2X4 receptor mRNAs in the PVN
Dark-field photomicrographs of emulsion-dipped slides hybridized with 35S-labelled riboprobes complementary to P2X3 (A) and P2X4 (B) mRNA. 3V, third ventricle; dp, dorsal parvocellular component of PVN; mp, medial parvocellular component of PVN; pm, posterior magnocellular component of PVN. Scale bar is 50 μm.
Figure 4
Figure 4. [Ca2+]i responses to ATP and the dose-response relation
A, representative time courses for [Ca2+]i responses to increasing concentrations of ATP obtained from a single SON neurone. The breaks in the trace are approximately 5 min. Horizontal bars in this and subsequent figures indicate the time during which drugs were applied. B, increments of [Ca2+]i from the baseline (Δ[Ca2+]i) in response to various concentrations of ATP were plotted against the ATP concentrations (n= 33). The sigmoidal curve was calculated with the Hill plot and the ED50 was estimated to be 1.7 × 10⁻⁵ M from the curve. C, representative time courses for [Ca2+]i responses to glutamate (Glu, 10−4 M) and ATP (10−3 M) obtained from a single SON neurone. D, summary data for Δ[Ca2+]i in response to glutamate (10−4 M) and ATP (10−3 M). The numbers in parentheses in this and subsequent figures represent the number of neurones examined.
Figure 5
Figure 5. Different patterns of desensitization in the ATP-induced [Ca2+]i increases
To observe the time course of desensitization of the ATP-induced [Ca2+]i increases, 10−4 M ATP was repeatedly added for 30 s in 1 min intervals to the same cells (n= 9). A, an example of the time course of ATP-induced [Ca2+]i changes, where rapid desensitization was observed. A similar pattern of desensitization was seen in two other neurones. B, an example of the time course of ATP-induced [Ca2+]i changes, where little desensitization was observed. Similar desensitization was seen in five other neurones. C, patterns of desensitization in the ATP-induced [Ca2+]i increase observed in nine neurones are plotted by normalizing each response to the first response. The responses obtained from individual neurones (represented by different symbols) were fitted with a linear equation.
Figure 6
Figure 6. [Ca2+]i responses to purinergic receptor agonists
A, representative time course of [Ca2+]i changes in response to αβMeATP (10−4 M), 2MeSATP (10−4 M), UDP (10−4 M), UTP (10−4 M), ADP (10−4 M) and ATP (10−4 M). The responses were obtained from a single SON neurone. The breaks in the trace are approximately 5 min. B, comparison between [Ca2+]i changes in response to ATP (10−4 M) and αβMeATP (10−4 M). C, [Ca2+]i changes in response to BzATP (10−5 and 10−4 M) and effects of oxidized ATP (oxATP, 3 × 10⁻⁴ M) on ATP (10−4 M)-induced [Ca2+]i changes. D, comparison between [Ca2+]i changes in response to ATP (10−4 M) and ATPγS (10−4 M). E, summary data for Δ[Ca2+]i in response to the P2 agonists. Ado, adenosine.
Figure 7
Figure 7. Effects of purinergic receptor antagonists on the ATP-induced [Ca2+]i increase
A, representative time courses showing effects of P2 antagonists suramin (10−4 M) and PPADS (10−4 M) on [Ca2+]i increases in response to ATP (10−4 M) obtained from a single neurone. The break in the trace is approximately 5 min. B, summary data for Δ[Ca2+]i in response to ATP (control, □ and formula image
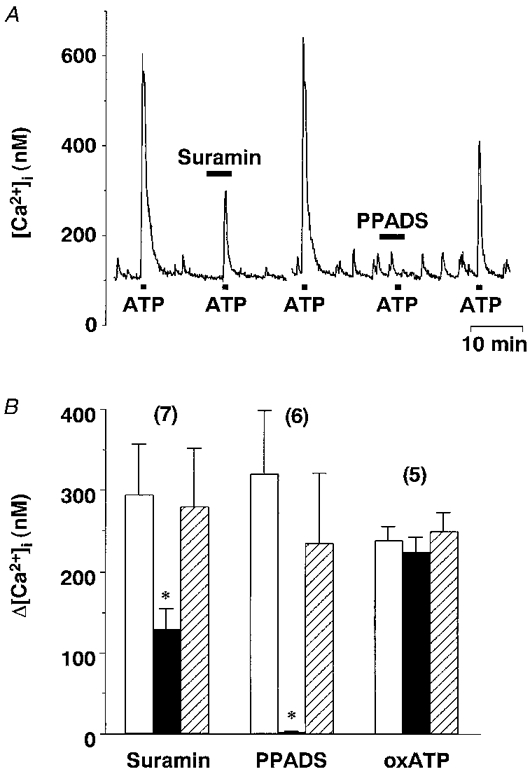
) and ATP plus the P2 antagonist (▪). Post-controls were obtained 10-20 min after withdrawal of each antagonist. * Significantly different (P < 0.05) from the mean of the pre- and post-control values obtained with ATP alone.
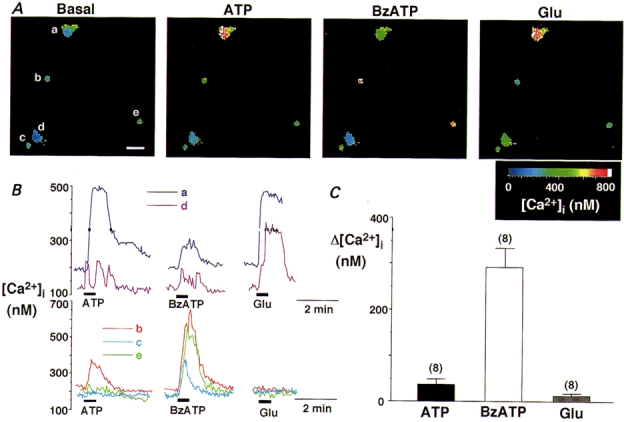
Figure 8
Figure 8. [Ca2+]i responses to ATP, BzATP and glutamate in non-neuronal cells
A, pseudo-colour [Ca2+]i images of neuronal and non-neuronal cells dissociated from the SON. The images showing responses to ATP (10−4 M), BzATP (10−4 M) and glutamate (10−4 M) were taken when [Ca2+]i reached a peak. Note that the two neuronal cells (the large cells marked a and d) responded to ATP, BzATP and glutamate, whereas the three other small cells (b, c and e) responded to BzATP (10−4 M) with the largest [Ca2+]i increases but did not respond to glutamate. Scale bar (lower right corner of the left-most panel) represents 25 μm. B, representative time courses of [Ca2+]i changes showing effects of ATP (10−4 M), BzATP (10−4 M) and glutamate (10−4 M) obtained in neuronal (upper panel) and non-neuronal cells (lower panel). C, summary data for Δ[Ca2+]i in response to ATP, BzATP and glutamate obtained in eight non-neuronal cells (including the three in A).
Figure 9
Figure 9. Analysis of the source of [Ca2+]i increases induced by ATP
A, representative example of the effect of extracellular Ca2+ removal on the ATP-induced [Ca2+]i increase. Note that a large [Ca2+]i increase seen after the second ATP application is due to Ca2+ reintroduction into the perfusion media. B, representative example of the effects of extracellular Na+ replacement with NMDG on the ATP-induced [Ca2+]i increase. C, representative example of the effects of CPA (10−5 M) on the ATP-induced [Ca2+]i increase. D, summary data for the effects of Ca2+ removal, Na+ replacement and CPA. * Significantly different (P < 0.05) from the value obtained with ATP alone.
Figure 10
Figure 10. Patch-clamp analysis of the ATP-induced currents
A and B, representative time courses of currents induced by glutamate (Glu, 10−4 M) and ATP (10−3 M) obtained from single SON neurones. A shows little desensitization, but B shows strong desensitization in the ATP-induced currents. In contrast, glutamate induced currents with similar time courses in both neurones. The holding potential was -80 mV. C, representative current responses to UTP (10−3 M), BzATP (10−4 M) and ATP (10−3 M) obtained from a single SON neurone. The breaks in the trace are 3-5 min. The holding potential was -80 mV. D, summary data for the peak inward currents induced by the purinergic agonists or glutamate. The major salt in the pipette used in experiments shown in this figure was caesium methanesulphonate.
Figure 11
Figure 11. Current-voltage relationship of the ATP-induced currents
A, representative I-V relationship of membrane currents obtained in the presence and absence of 10−3 M ATP with caesium methanesulphonate as the major salt in the pipette. B, I-V relationship of currents obtained by subtracting the control currents from the currents obtained with 10−3 M ATP shown in A. C, representative I-V relationship of membrane currents obtained in the presence and absence of 10−3 M ATP with CsCl as the major salt in the pipette. D, I-V relationship of currents obtained by subtracting the control currents from the currents obtained with 10−3 M ATP shown in C.

References

    1. Bardoni R, Goldstein PA, Lee CJ, Gu JG, MacDermott AB. ATP P2X receptors mediate fast synaptic transmission in the dorsal horn of the rat spinal cord. Journal of Neuroscience. 1997;17:5297–5304. - PMC - PubMed
    1. Bo X, Zhang Y, Nassar M, Burnstock G, Schoepfer R. A P2X purinoceptor cDNA conferring a novel pharmacological profile. FEBS Letters. 1995;375:129–133. - PubMed
    1. Brussaard AB, Kits KS, de Vlieger TA. Postsynaptic mechanism of depression of GABAergic synapses by oxytocin in the supraoptic nucleus of immature rat. The Journal of Physiology. 1996;497:495–507. - PMC - PubMed
    1. Buell G, Lewis C, Collo G, North RA, Surprenant A. An antagonist-insensitive P2X receptor expressed in epithelia and brain. EMBO Journal. 1996;15:55–62. - PMC - PubMed
    1. Buller KM, Khanna S, Sibbald JR, Day TA. Central noradrenergic neurons signal via ATP to elicit vasopressin responses to haemorrhage. Neuroscience. 1996;73:637–642. - PubMed

Publication types

MeSH terms

LinkOut - more resources