

Glucocorticoid modulation of Ca2+ homeostasis in human B lymphoblasts
- PMID: 9852321
- PMCID: PMC2269066
- DOI: 10.1111/j.1469-7793.1999.385ae.x
Glucocorticoid modulation of Ca2+ homeostasis in human B lymphoblasts
Abstract
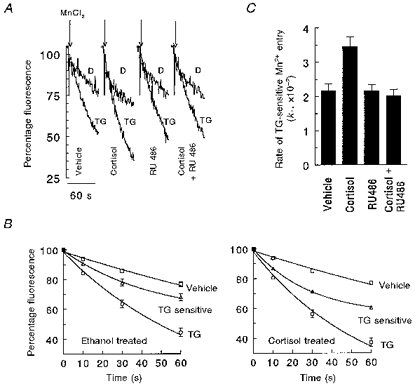
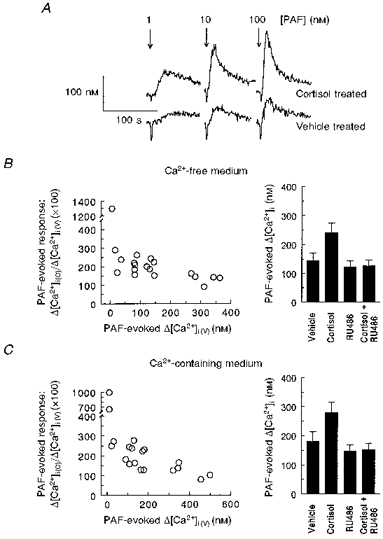
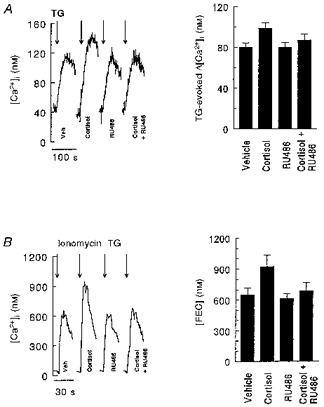
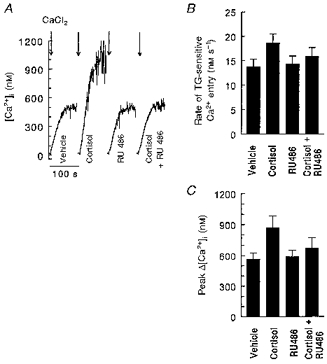
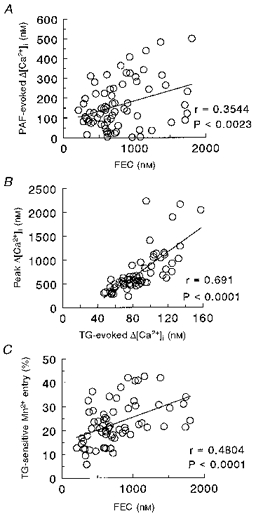
1. We determined the effect of cortisol (200 nM for 48 h) on the intracellular Ca2+ concentration ([Ca2+]i) and parameters of Ca2+i signalling in 19 lymphoblastoid cell lines (LCLs). 2. Using the fluorescent dye fura-2, the basal [Ca2+]i in Ca2+-containing medium was 63.5 +/- 2.4 nM in vehicle (ethanol)-treated LCLs and 55.7 +/- 2. 6 nM (mean +/- s.e.m.) in cortisol-treated LCLs. 3. Ca2+i signalling following platelet-activating factor (PAF, 100 nM) addition was enhanced by cortisol treatment, with LCLs having small PAF responses showing the largest percentage increase after cortisol treatment. Mean peak [Ca2+]i responses to PAF were enhanced 67.0% and 55.7% in Ca2+-free and Ca2+-containing medium, respectively. 4. The endoplasmic reticulum Ca2+-ATPase inhibitor thapsigargin (100 nM) caused a transient increase in [Ca2+]i in Ca2+-free medium in which the peak change was increased in cortisol-treated cells (98.5 +/- 5.8 vs. 79.8 +/- 4.5 nM). Peak changes in the freely exchangeable Ca2+ in response to 5 microM ionomycin were also enhanced in cortisol-treated cells (923.7 +/- 113.9 vs. 652.2 +/- 64.5 nM) and correlated to the PAF-evoked [Ca2+]i response. 5. Cortisol-treated LCLs exposed to thapsigargin to empty intracellular Ca2+ stores (10 min treatment in Ca2+-free medium) and exposed to CaCl2 or MnCl2 had a greater rate of Ca2+ entry (18.6 +/- 1.8 vs. 13.8 +/- 1.5 nM s-1) and higher rate constant for Mn2+ entry (0.0345 +/- 0.0029 vs. 0. 0217 +/- 0.0020) than vehicle-treated cells. Peak [Ca2+]i in cells exposed to CaCl2 was also enhanced (869.4 +/- 114.7 vs. 562.6 +/- 61.7 nM). Parameters of divalent cation influx were highly correlated to the peak [Ca2+]i elicited by thapsigargin or ionomycin. 6. Inclusion of RU 486 (a glucocorticoid antagonist) with cortisol prevented the decrease in basal [Ca2+]i and stimulatory actions of cortisol on all Ca2+i parameters. RU 486 alone had no apparent effects on basal [Ca2+]i or Ca2+i signalling. 7. Based on data obtained over a wide range of responses (in the presence and/or absence of cortisol or RU 486), the results show that cortisol stimulation of glucocorticoid receptors decreases basal [Ca2+]i and enhances PAF-evoked [Ca2+]i signalling, most probably through its effects on intracellular Ca2+ stores. In turn, the extent of Ca2+ entry via store-operated plasma membrane Ca2+ channels is closely linked to the size of the Ca2+ stores.
Figures
Similar articles
-
Calcium influx evoked by Ca2+ store depletion in human platelets is more susceptible to cytochrome P-450 inhibitors than receptor-mediated calcium entry.Cell Calcium. 1992 Oct;13(9):553-64. doi: 10.1016/0143-4160(92)90035-q. Cell Calcium. 1992. PMID: 1334809
-
Vasopressin stimulation of Ca2+ mobilization, two bivalent cation entry pathways and Ca2+ efflux in A7r5 rat smooth muscle cells.J Physiol. 1995 Jun 1;485 ( Pt 2)(Pt 2):455-68. doi: 10.1113/jphysiol.1995.sp020742. J Physiol. 1995. PMID: 7666368 Free PMC article.
-
Divalent cation entry in cultured rat cerebellar granule cells measured using Mn2+ quench of fura 2 fluorescence.Eur J Neurosci. 1995 May 1;7(5):831-40. doi: 10.1111/j.1460-9568.1995.tb01070.x. Eur J Neurosci. 1995. PMID: 7613620
-
Role of the endoplasmic reticulum in shaping calcium dynamics in human lens cells.Invest Ophthalmol Vis Sci. 2001 Apr;42(5):1009-17. Invest Ophthalmol Vis Sci. 2001. PMID: 11274079
-
Transient inhibition by chemotactic peptide of a store-operated Ca2+ entry pathway in human neutrophils.J Biol Chem. 1993 Jun 25;268(18):13055-61. J Biol Chem. 1993. PMID: 8390453
Cited by
-
Non-genomic Effects of Glucocorticoids: An Updated View.Trends Pharmacol Sci. 2019 Jan;40(1):38-49. doi: 10.1016/j.tips.2018.11.002. Epub 2018 Nov 26. Trends Pharmacol Sci. 2019. PMID: 30497693 Free PMC article. Review.
-
Glucocorticoid stimulation increases cardiac contractility by SGK1-dependent SOCE-activation in rat cardiac myocytes.PLoS One. 2019 Sep 9;14(9):e0222341. doi: 10.1371/journal.pone.0222341. eCollection 2019. PLoS One. 2019. PMID: 31498847 Free PMC article.
-
Defining the Differential Corticosteroid Response Basis from Multiple Omics Approaches.Int J Mol Sci. 2024 Dec 19;25(24):13611. doi: 10.3390/ijms252413611. Int J Mol Sci. 2024. PMID: 39769372 Free PMC article. Review.
-
Dexamethasone stimulates store-operated calcium entry and protein degradation in cultured L6 myotubes through a phospholipase A(2)-dependent mechanism.Am J Physiol Cell Physiol. 2010 May;298(5):C1127-39. doi: 10.1152/ajpcell.00309.2009. Epub 2010 Jan 27. Am J Physiol Cell Physiol. 2010. PMID: 20107037 Free PMC article.
-
Rapid and non-genomic reduction of intracellular [Ca(2+)] induced by aldosterone in human bronchial epithelium.J Physiol. 2001 Nov 15;537(Pt 1):267-75. doi: 10.1111/j.1469-7793.2001.0267k.x. J Physiol. 2001. PMID: 11711579 Free PMC article.
References
-
- Agarwal MK, Hainque B, Moustaid N, Lazer G. Glucocorticoid antagonists. FEBS Letters. 1987;217:221–226. 10.1016/0014-5793(87)80667-1. - DOI - PubMed
-
- Ambrus JL, Jr, Chesky L, McFarland P, Young KR, Jr, Mostowski H, August A, Chused TM. Induction of proliferation by high molecular weight B cell growth factor or low molecular weight B cell growth factor is associated with increases in intracellular calcium in different subpopulations of human B lymphocytes. Cellular Immunology. 1991;134:314–324. - PubMed
-
- Balasubramanyam M, Condrescu M, Reeves JP, Gardner JP. Sodium/calcium exchange activities in cultured lymphocyte and monocyte cell lines. Biophysical Journal. 1996;70(A205)
-
- Baus E, Andris F, Dubois PM, Urbain J, Leo O. Dexamethasone inhibits the early steps of antigen receptor signaling in activated T lymphocytes. Journal of Immunology. 1996;156:4555–4561. - PubMed
-
- Bian X, Hughes FM, Jr, Huang Y, Cidlowski JA, Putney JW., Jr Roles of cytoplasmic Ca2+ and intracellular Ca2+ stores in induction and suppression of apoptosis in S49 cells. American Journal of Physiology. 1997;272:C1241–1249. - PubMed
Publication types
MeSH terms
Substances
Grants and funding
LinkOut - more resources
Full Text Sources
Medical
Miscellaneous