. 1999 Jan 15;514 ( Pt 2)(Pt 2):397-411.
doi: 10.1111/j.1469-7793.1999.397ae.x.

Divalent cation permeability and blockade of Ca2+-permeant non-selective cation channels in rat adrenal zona glomerulosa cells

Affiliations

Divalent cation permeability and blockade of Ca2+-permeant non-selective cation channels in rat adrenal zona glomerulosa cells

D P Lotshaw et al. J Physiol. .

Abstract

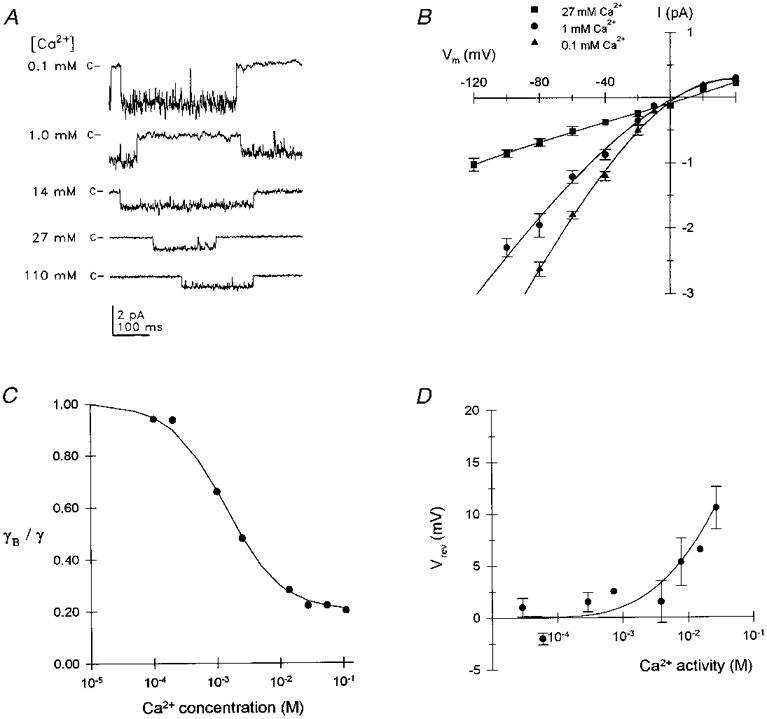
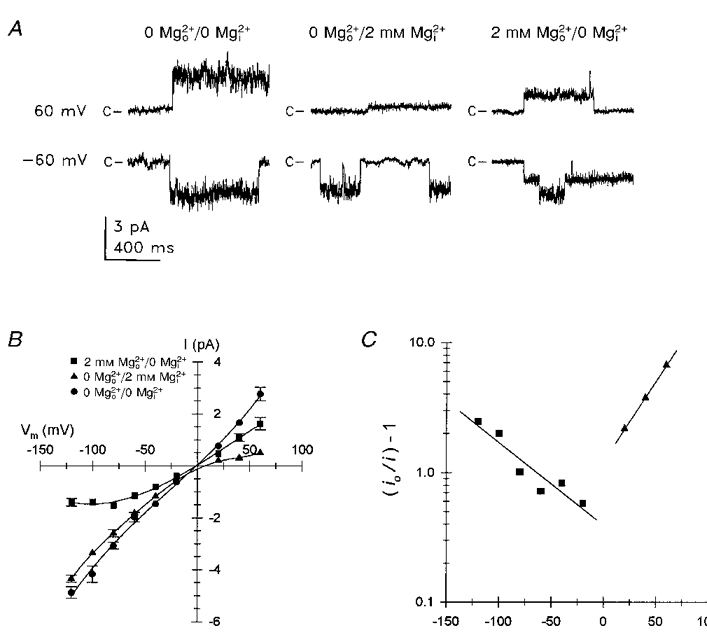
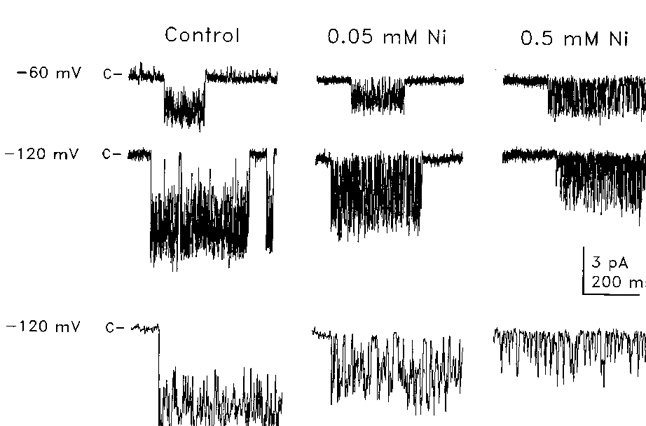
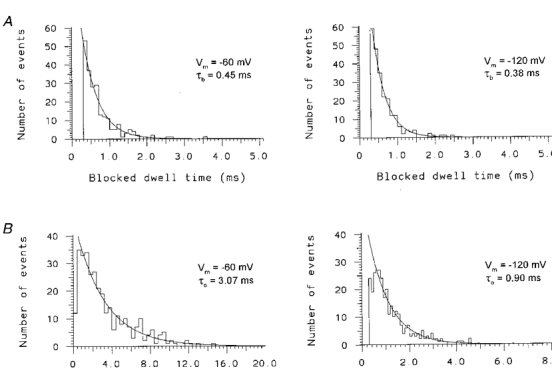
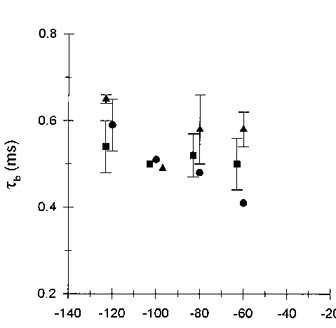
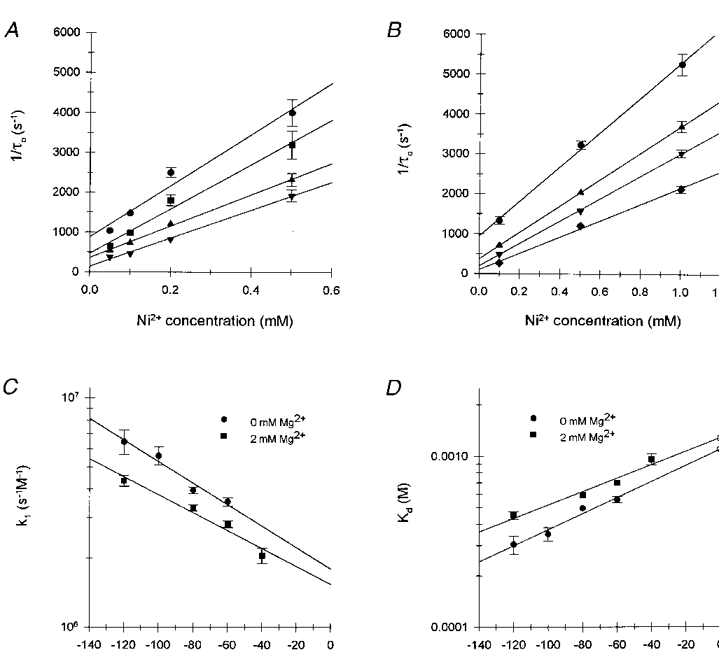
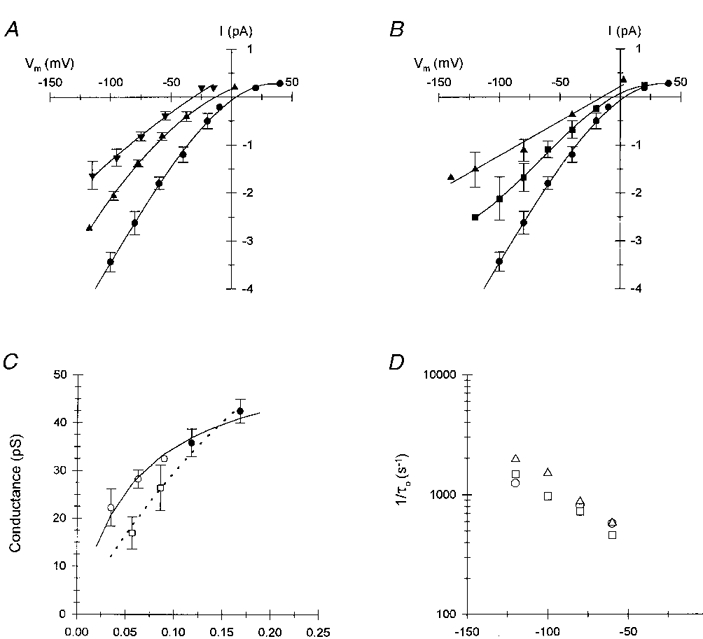
1. The effects of the divalent cations Ca2+, Mg2+ and Ni2+ on unitary Na+ currents through receptor-regulated non-selective cation channels were studied in inside-out and cell-attached patches from rat adrenal zona glomerulosa cells. 2. External Ca2+ caused a concentration-dependent and voltage-independent inhibition of inward Na+ current, exhibiting an IC50 of 1.4 mM. The channel was also Ca2+ permeant and external Ca2+ shifted the reversal potential as expected for a channel exhibiting a constant Ca2+ : Na+ permeability ratio near to 4. 3. External and internal 2 mM Mg2+ caused voltage-dependent inhibition of inward and outward Na+ current, respectively. Modelling Mg2+ as an impermeant fast open channel blocker indicated that external Mg2+ blocked the pore at a single site exhibiting a zero voltage Kd of 5.1 mM for Mg2+ and located 19 % of the distance through the transmembrane electric field from the external surface. Internal Mg2+ blocked the pore at a second site exhibiting a Kd of 1.7 mM for Mg2+ and located 36% of the distance through the transmembrane electric field from the cytosolic surface. 4. External Ni2+ caused a voltage- and concentration-dependent slow blockade of inward Na+ current. Modelling Ni2+ as an impermeant slow open channel blocker indicated that Ni2+ blocked the pore at a single site exhibiting a Kd of 1.09 mM for Ni2+ and located 13.7% of the distance through the transmembrane electric field from the external surface. 5. External 2 mM Mg2+ increased the Kd for external Ni2+ binding to 1.27 mM, consistent with competition for a single binding site. Changing ionic strength did not substantially affect Ni2+ blockade indicating the absence of surface potential under physiological ionic conditions. 6. It is concluded that at least two divalent cation binding sites, separated by a high free energy barrier (the selectivity filter), are located in the pore and contribute to Ca2+ selectivity and permeability of the channel.


Figures

Scheme 1
Scheme 1
Figure 1
Figure 1. Effects of extracellular Ca2+ on unitary Na+ currents
A, current traces illustrating representative single channel events measured at -80 mV for several Ca2+ concentrations (indicated at the left of each trace). The closed channel current level is indicated by c at the left of the traces; each trace was taken from a different patch. The external (pipette) solution composition for each Ca2+ concentration is described in Table 1; the bath (cytosolic face) saline was nominally Ca2+ free (solution 15). Current records were low-pass filtered at 500 Hz for display. B, I-V relationships are plotted from data obtained with 0.1 mM Ca2+ (▴, n= 5), 1.0 mM Ca2+ (•, n= 5) and 27 mM Ca2+ (▪, n= 3) pipette solutions. Symbols indicate the mean (±s.e.m.) unitary current amplitude; error bars are not shown for errors less than symbol size. Smooth curves represent polynomial regression fits to each data set. C, fractional inward slope conductance is plotted as a function of Ca2+ concentration: γB represents mean conductance at each Ca2+ concentration and γ the mean maximal conductance in the absence of external Ca2+. The smooth curve represents the best fit to a Langmuir isotherm, indicating an IC50 of 1.4 mM for Ca2+ inhibition. D, Vrev of unitary currents is plotted as a function of external Ca2+ activity. Symbols represent the mean (±s.e.m.) of 3-5 determinations at each concentration; symbols lacking error bars represent the means of 2 determinations. The smooth curve represents the change in Vrev predicted from the modified GHK equation (eqn (1)) assuming a constant Ca2+:Na+ permeability ratio of 4.
Figure 2
Figure 2. Voltage-dependent inhibition of unitary Na+ currents by external and internal 2 mM Mg2+
A, current traces illustrating representative single channel events obtained from inside-out patches at membrane potentials of 60 and -60 mV in the absence of both external and internal Mg2+ (left traces), with 2 mM internal Mg2+ (middle traces), and with 2 mM external Mg2+ (right traces). The patch recording for 2 mM external Mg2+ exhibited two open channel current levels. The closed channel current level is indicated by c at the left of each trace. Subscripts o and i designate external and internal Mg2+, respectively. Pipettes contained either solution 5 (0 Mg2+) or solution 14 (2 mM Mg2+) and the bath contained either solution 13 (0 Mg2+) or solution 15 (2 mM Mg2+) (Table 1). Current traces were low-pass filtered at 500 Hz for display. B, I-V relationship for single channel currents measured for each Mg2+ condition described in A. Symbols represent the mean (±s.e.m.) of unitary current amplitude from 3 or 4 separate patches in each configuration; error bars were omitted when error was less than symbol size. Lines represent polynomial least-squares regression fits to each data set. C, linearized logarithmic plot (eqn (2)) of voltage-dependent inhibition of unitary Na+ curent amplitude by extracellular and cytoplasmic 2 mM Mg2+. Symbols represent the reduction in current (io/i) - 1, where io represents the mean maximal current in the absence of Mg2+ and i represents the mean current recorded with 2 mM Mg2+o/0 mM Mg2+i (▪) or 0 mM Mg2+o/2 mM Mg2+i (▴); data from B. Curves represent the linear regression fit to the data.
Figure 3
Figure 3. External Ni2+-induced fluctuations in unitary Na+ currents
Current traces illustrating representative single channel events recorded from cell-attached patches at -60 mV (upper traces) and -120 mV (lower traces) in the absence of Ni2+ (control traces, left), in 0.05 mM Ni2+ (middle traces), and in 0.5 mM Ni2+ (right traces). The pipettes contained solution 5 (Table 1) with Ni2+ added hyperosmotically. Resting membrane potential was set to 0 mV with a high K+ saline (solution 3). Expanded time scale segments of current traces recorded at -120 mV are shown to illustrate Ni2+-induced blocking events. The closed and blocked channel current levels are indicated by c at the left of each trace. Current traces were low-pass filtered at 2 kHz.
Figure 4
Figure 4. Open and blocked state dwell time histograms for 0.1 mM Ni2+ blockade of unitary Na+ currents
A, blocked state dwell time histograms measured at -60 mV (left graph) and -120 mV (right graph) from a single cell-attached patch with 0.1 mM Ni2+ in the pipette solution (solution 5, Table 1). B, open state dwell time histograms measured at -60 mV (left graph) and -120 mV (right graph) from the same patch as in A. The resting membrane potential was set to 0 mV with a high extracellular K+ saline (solution 3). The smooth curves in each graph represent the maximum likelihood fit of the data to a single exponential relaxation. The time constants of the fitted exponential relaxations for τb (A) and τo (B), and membrane potentials (Vm) are indicated in the inset of each histogram.
Figure 5
Figure 5. Effects of membrane potential and Ni2+ concentration on τb
Mean blocked times measured in the presence of 0.05 mM (•), 0.2 mM (▪) and 0.5 mM (▴) Ni2+ at -60, -80, -100 and -120 mV; symbols are offset to illustrate clearly standard deviations of the data. Symbols represent the mean (±s.d.) of 3-4 separate patches at each voltage and Ni2+ concentration; symbols lacking error bars represent the mean value from two separate patches.
Figure 6
Figure 6. Determination of Kd(0) and location (δ) of the Ni2+ binding site in the absence and presence of external Mg2+
A, the reciprocal of τo for Ni2+ blockade in the absence of external Mg2+ (pipette solution 5) is plotted as a function of external Ni2+ concentration. Data are shown for membrane potentials of -120 mV (•), -100 mV (▪), -80 mV (▴) and -60 mV (▾). Values of τo represent single exponential maximum likelihood fits to pooled data from 2-4 patches at each voltage and Ni2+ concentration; the number of pooled blocking events for each τo ranged between 300 and 1400. Values of τo were corrected for missed blocking events. Error bars indicate the standard deviation and are not shown for values less than symbol size. B, reciprocal τo values for Ni2+ blockade, measured in the presence of 2 mM Mg2+ (solution 14), are plotted as a function of Ni2+ concentration. Data are shown for membrane potentials of -120 mV (•), -80 mV (▴), -60 mV (▾) and -40 mV (♦). Values of τo and error bars are as described in A; each value represents fits to pooled data from 2-4 patches containing 500-700 blocking events. C, voltage-dependent association rate constants, k1(V), determined from the slope of the regression lines in A and B for Ni2+ blockade in the absence (•) and presence (▪) of 2 mM external Mg2+, respectively. Error bars represent the standard error of the regression coefficients. D, the voltage dependence of the dissociation constant, Kd, for Ni2+ binding in the absence and presence of 2 mM Mg2+. Open symbols represent Kd(0) determined from extrapolation of the linear regression fits to each data set (continuous curves). Error bars represent the error extrapolated from the standard errors for k1(V). For all figures, smooth curves represent the linear regression fits to the data.
Figure 7
Figure 7. Effects of ionic strength on Na+ conductance and Ni2+ blockade
A, effect of decreasing external NaCl concentration and ionic strength on the I-V relationships of unitary currents obtained from inside-out patches; pipette contained 150 mM NaCl (•), 75 mM NaCl (▴) and 37.5 mM NaCl (▾). Ionic strength was decreased by substitution of glucose for NaCl (mixing solutions 5 and 18, Table 1); the bath contained solution 15. Symbols represent the mean (±s.d.) current amplitude from 3-5 patches at each NaCl concentration; errors less than symbol size are not shown. Smooth curves represent 3rd order or 2nd order (75 and 37.5 mM NaCl) regression fits to the data. B, effect of decreasing external NaCl concentration at constant ionic strength on the I-V relationship; pipette contained 150 mM NaCl (•), 112.5 mM NaCl (▪) and 75 mM NaCl (▴). Ionic strength was maintained by substitution of NMDG for NaCl (mixing of solutions 5 and 19); the bath contained solution 15. Symbols represent the mean (±s.d.) from 3-6 patches at each NaCl concentration. Smooth curves represent 3rd order or linear (75 mM NaCl) regression fits to the data. C, Na+ concentration dependence of inward slope conductance for variable ionic strength (glucose substitution, ○) and constant ionic strength (NMDG substitution, □) data from A and B. Filled circles represent channel conductance in 150 and 225 mM NaCl (pipette solution 16/bath solution 17). Symbols represent the mean (±s.d.) from 3-6 patches for each ionic condition. Continuous and dashed curves represent fits to the Michaelis-Menton equation for the glucose-substituted and NMDG-substituted data, respectively. D, effect of ionic strength on the voltage dependence of reciprocal τo for 0.1 mM Ni2+ blockade of unitary Na+ currents in cell-attached patches: 225 mM NaCl (pipette solution 16, ○), 150 mM NaCl (solution 5, □), or 112.5 mM NaCl (mixing solutions 5 and 18, ▵). Symbols represent reciprocal of corrected τo values determined from data pooled from 3 separate patches containing between 400 and 1500 blocking events at each ionic strength and membrane potential. Standard deviations were less than symbol size.

Similar articles

Cited by

References

    1. Butler JN. The thermodynamic activity of calcium ion in sodium chloride-calcium chloride electrolytes. Biophysical Journal. 1968;8:1426–1433. - PMC - PubMed
    1. Carbone E, Lux HD, Carabelli V, Aicardi G, Zucker H. Ca2+ and Na+ permeability of high-threshold Ca2+ channels and their voltage-dependent block by Mg2+ ions in chick sensory neurones. The Journal of Physiology. 1997;504:1–15. - PMC - PubMed
    1. Changeux JP, Galzi JL, Devillers-Thiéry A, Bertrand D. The functional architecture of the acetylcholine nicotinic receptor explored by affinity labeling and site-directed mutagenesis. Quarterly Review of Biophysics. 1992;25:395–432. - PubMed
    1. Colquhoun D, Sigworth FJ. Single Channel Recording. New York and London: Plenum Press; 1995. Fitting and statistical analysis of single-channel records; pp. 483–585.
    1. Coronado R, Affolter H. Insulation of the conduction pathway of muscle transverse tubule calcium channels from the surface charge of the bilayer phospholipid. Journal of General Physiology. 1986;87:933–953. - PMC - PubMed

Publication types

MeSH terms

LinkOut - more resources