

High intracellular chloride delays the activation of the volume-sensitive chloride conductance in mouse L-fibroblasts
- PMID: 9852325
- PMCID: PMC2269082
- DOI: 10.1111/j.1469-7793.1999.437ae.x
High intracellular chloride delays the activation of the volume-sensitive chloride conductance in mouse L-fibroblasts
Abstract
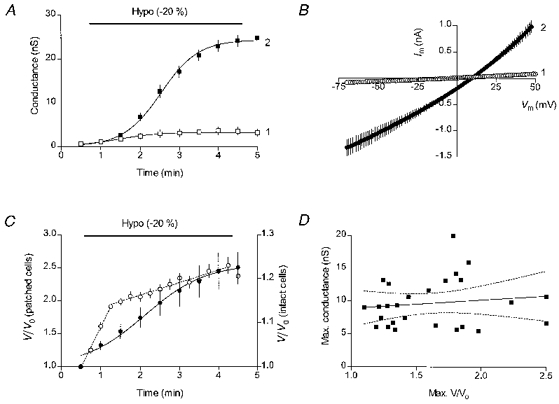
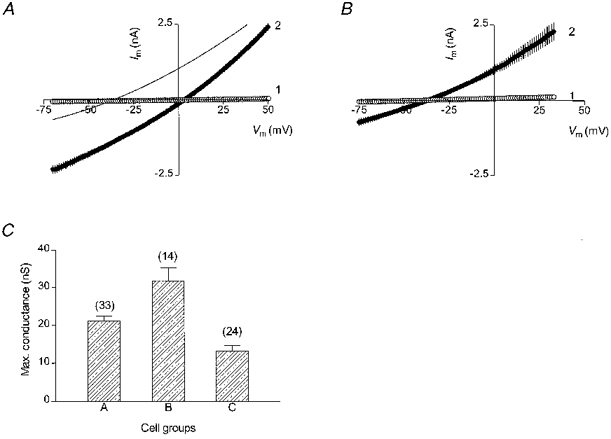
1. The relationship between cell volume and volume-sensitive Cl- conductance during hyposmotic cell swelling of patched cells and the effects of intracellular chloride on the conductance have been studied in mouse L-fibroblasts. To this end, swelling-activated current and cell volume were measured simultaneously in cells dialysed with low-Cl- (16 mM) or high-Cl- (130 mM) solutions using the whole-cell patch-clamp technique and videomicroscopy. 2. The increase in cell volume of patched cells and the volume-sensitive conductance saturated during a 4-5 min exposure to mildly hyposmotic solutions (15-20 % less than isosmotic). The swelling of patched cells varied considerably and was greater than the swelling of intact cells. No correlation between the maximal values of the volume-sensitive conductance and the maximal volumes of swollen cells was evident for cells dialysed with the low-Cl- solutions. 3. The amplitude of the volume-sensitive conductance decreased with a reduction in either extracellular or intracellular Cl- concentration; the size of the maximal conductance was not modulated by intracellular Cl- ions. 4. The activation of the volume-sensitive conductance was slower in high-Cl- cells than in low-Cl- cells whether it was induced by hypotonic cell swelling or by cell inflation; in low-Cl- cells the conductance saturated before the cell volume had reached its maximal value. 5. It is concluded that in patched cells an increase in cell volume triggers activation of the volume-sensitive Cl- conductance but does not determine its amplitude and that the rate of activation of the conductance is affected by the intracellular Cl- concentration.
Figures
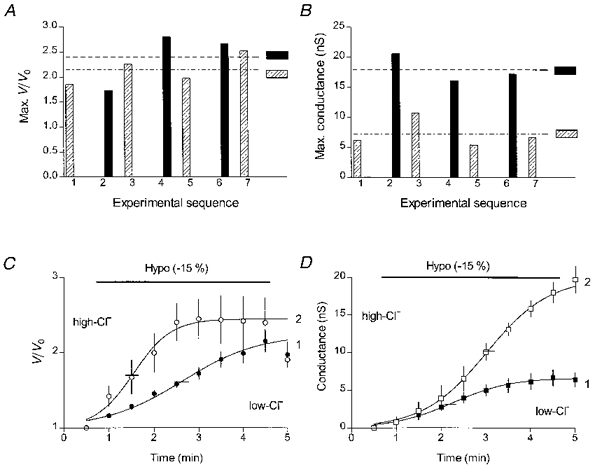
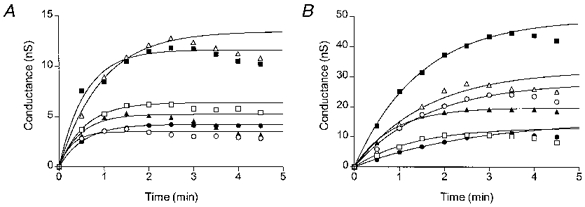
 ) or high-Cl− solution (▪) during application of the 255 mosmol kg−1 (-15 %) hyposmotic solution. The mean volumes of swollen cells in each group are shown by the horizontal interrupted lines. B, comparison of maximal swelling-induced conductances in the same cells. The interrupted lines show the mean conductances in each cell group. C, time course of volume changes in the low-Cl− (•, n= 4) and the high-Cl− (○, n= 3) cells. Short horizontal lines (here and in panel D) cross the fitted curves at their mid-points. D, time course of the swelling-induced conductance in the low-Cl− (▪) and the high-Cl− (□) cells. Here and in the following figures, the pre-swelling conductance value has been subtracted from all conductance values.
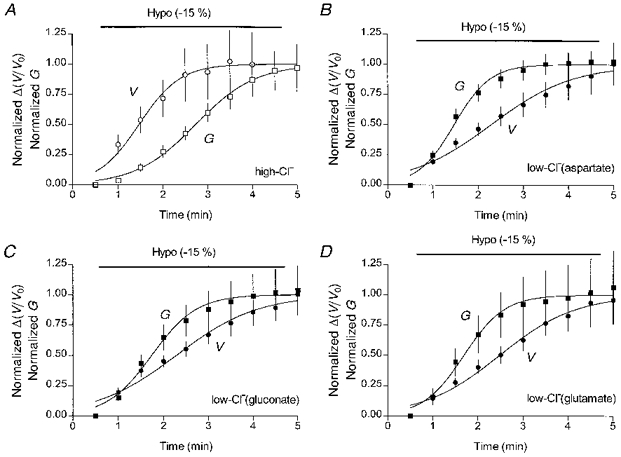
References
-
- Crowe WE, Altamirano J, Huerto L, Alvarez-Leefmans FJ. Volume changes in single N1E-115 neuroblastoma cells measured with a fluorescent probe. Neuroscience. 1995;69:283–296. - PubMed
-
- Doroshenko P. Pervanadate inhibits volume-sensitive chloride current in bovine chromaffin cells. Pflügers Archiv. 1998;435:303–309. - PubMed
-
- Du X-Y, Sorota S. Cardiac swelling-induced chloride current depolarizes canine atrial myocytes. American Journal of Physiology. 1997;272:H1904–1916. - PubMed
Publication types
MeSH terms
Substances
LinkOut - more resources
Full Text Sources