. 1999 Jan 15;514 ( Pt 2)(Pt 2):493-503.
doi: 10.1111/j.1469-7793.1999.493ae.x.

Resetting and postnatal maturation of oxygen chemosensitivity in rat carotid chemoreceptor cells

Affiliations

Resetting and postnatal maturation of oxygen chemosensitivity in rat carotid chemoreceptor cells

M J Wasicko et al. J Physiol. .

Abstract

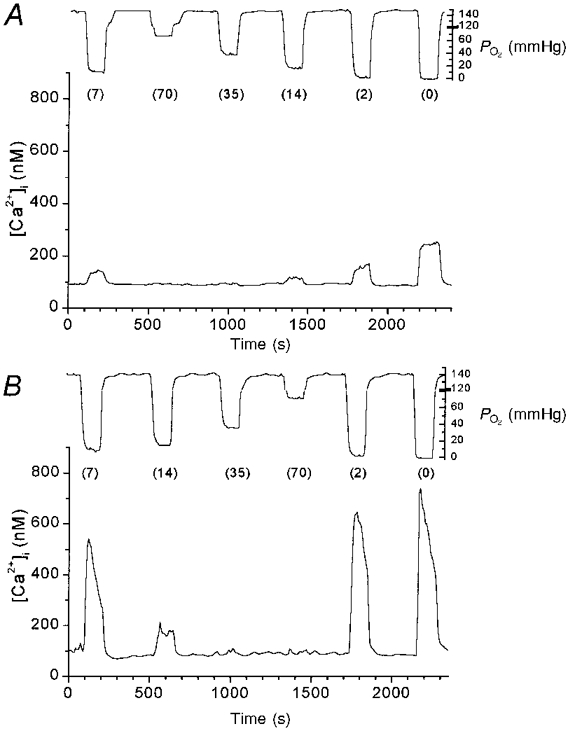
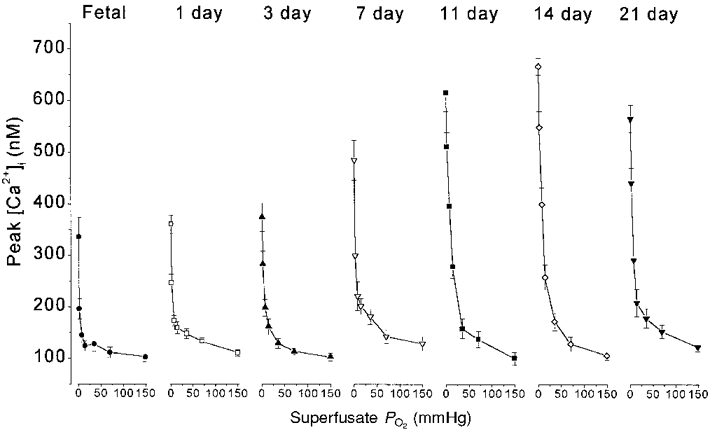
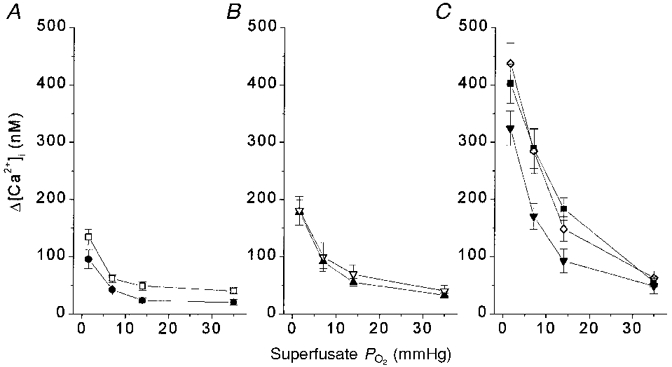
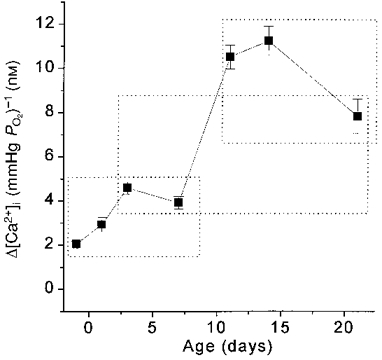
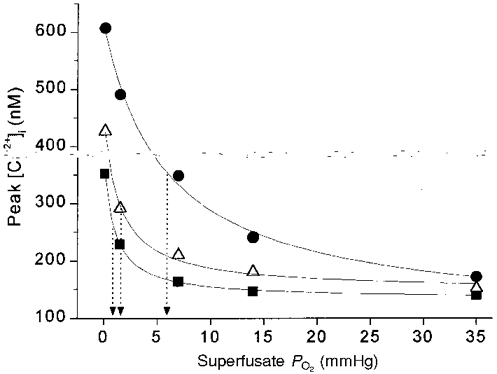
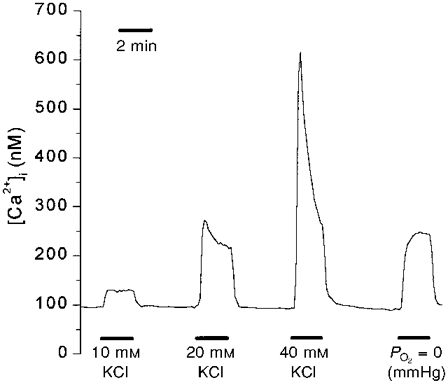
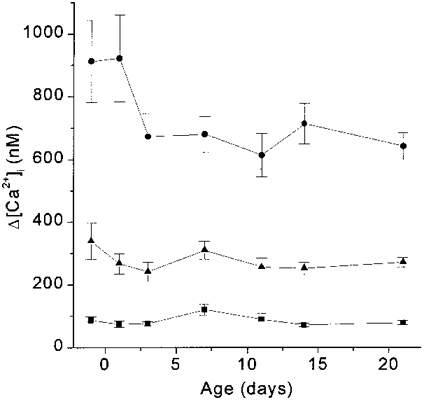
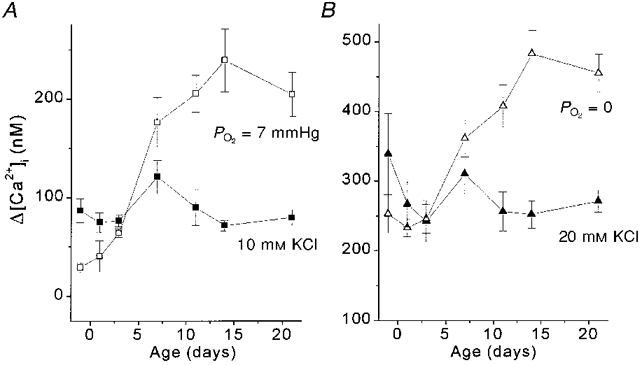
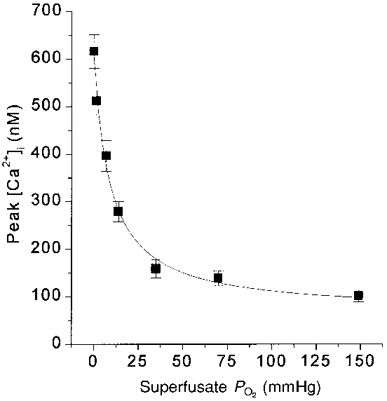
1. Carotid chemoreceptor sensitivity is minimal immediately after birth and increases with postnatal age. In the present study we have investigated the peri- and postnatal developmental time course of [Ca2+]i responses to hypoxia in clusters of type I cells isolated from near-term fetal rats and rats that were 1, 3, 7, 11, 14 and 21 days old, using the Ca2+-sensitive fluoroprobe fura-2. 2. In type I cells from all age groups a graded increase in [Ca2+]i occurred in response to lowering the PO2 from 150 mmHg to 70, 35, 14, 7, 2 and 0 mmHg. The graded [Ca2+]i response to hypoxia was hyperbolic at all ages. 3. Type I cells from rats near-term fetal to 1 day old exhibited small [Ca2+]i responses, mainly to the most severe levels of hypoxia. After day 1, an increase in the [Ca2+]i responses to submaximal hypoxia stimulation resulted in a rightward shift in the O2 response curve. Using the Delta[Ca2+]i between 35 and 2 mmHg PO2 as an index of O2 sensitivity, type I cell O2 sensitivity increased approximately 4- to 5-fold between near-term fetal to 1 day old and 11 to 14 days of age. 4. Exposure to elevated extracellular potassium (10, 20 and 40 mM K+) caused a dose-dependent [Ca2+]i rise in type I cells from all age groups. There were no age-related changes in [Ca2+]i responses to any level of K+ between near-term fetal and 21 days. 5. We conclude that the maximal type I cell [Ca2+]i response to anoxia, as well as the sensitivity to submaximal hypoxic stimulation, of rats aged from near-term fetal to 21 days depends on the level of postnatal maturity. The lack of an age-related increase in the [Ca2+]i response to elevated K+ during the timeframe of maximal development of O2 sensitivity suggests that resetting involves maturation of O2 sensing, rather than non-specific developmental changes in the [Ca2+]i rise resulting from depolarization.


Figures

Figure 1
Figure 1. Effects of hypoxia on [Ca2+]i in rat type I cells
Tracings showing [Ca2+]ivs. time during 2 experimental runs in type I cell clusters from near-term fetal rats (A) and 14-day-old rats (B). Each line represents [Ca2+]i measurements from one cluster of type I cells. The tracing from the superfusate PO2 electrode is shown above each graph. Numbers in parentheses are superfusate PO2 (in mmHg).
Figure 2
Figure 2. Response to graded hypoxia during development
Mean [Ca2+]i response to graded hypoxia at each age studied. Each point represents the mean ±s.e.m. of peak [Ca2+]i values for a given superfusate PO2.
Figure 3
Figure 3. Δ[Ca2+]i for PO2 levels between ≈2 and ≈35 mmHg vs. age
Δ[Ca2+]i responses to hypoxia challenge at PO2 levels of ≈2, 7, 14 and 35 mmHg at all 7 ages. A: •, fetal; □, 1 day. B: ▴, 3 days; ▿, 7 days. C:▪, 11 days; ⋄, 14 days; ▾, 21 days. Δ[Ca2+]i values at the lowest PO2 shown (≈2 mmHg) were not different between 11 and 21 days, but all were significantly greater than the corresponding responses at younger ages. With less hypoxic superfusate PO2 levels, ANOVA detected fewer significant changes with age. n= 10, 18, 8, 7, 9, 9 and 16 clusters at near-term fetal, 1, 3, 7, 11, 14 and 21 days, respectively.
Figure 4
Figure 4. Change in type I cell O2‘sensitivity’ with age
Mean Δ[Ca2+]i (mmHg PO2)−1 from 2 to 35 mmHg for each age group. Values enclosed within a dotted box were not significantly different.
Figure 5
Figure 5. Rightward shift in the submaximal portion of the O2 response profile with age in pooled age groups
Mean peak [Ca2+]i responses of carotid chemoreceptor cells from 3 age groups, plotted vs. superfusate PO2. ▪, fetal-1 day (n= 28 clusters); ▵, 3-7 days (n= 15 clusters); •, 11-21 days (n= 34 clusters). Data in each age group fitted with hyperbolic function [Ca2+]i= (a + c) - {(aPO2)/(b+PO2)} using the least-squares method. Arrows indicate superfusate PO2 at half-maximal [Ca2+]i response (b value in hyperbolic function).
Figure 6
Figure 6. Typical type I cell responses to elevated extracellular K+
The line represents mean [Ca2+]i values for one cluster of type I cells from near-term fetal rats.
Figure 7
Figure 7. Development of Δ[Ca2+]i responses to elevated extracellular K+
Δ[Ca2+]i responses to 10 mM KCl (▪), 20 mM KCl (▴) and 40 mM KCl (•). ANOVA revealed no statistically significant differences with age in the [Ca2+]i response to any concentration of KCl.
Figure 8
Figure 8. Maturation of [Ca2+]i response to hypoxia vs. KCl
Δ[Ca2+]i responses to 10 and 20 mM KCl are shown with [Ca2+]i responses to hypoxia occurring in the same range. A, the Δ[Ca2+]i response to hypoxia (7 mmHg) (□) significantly increased ≈3-fold between 3 and 11 days (P < 0.001), while the response to 10 mM KCl did not change with age (▪). B,Δ[Ca2+]i response to PO2= 0 mmHg (with Na2S2O4; ▵) doubled between 3 and 14 days (P < 0.001) while the Δ[Ca2+]i response to 20 mM KCl (▴) did not change significantly with age by ANOVA.
Figure 9
Figure 9. [Ca2+]i response to hypoxia in 11 day group
Each point represents mean of peak [Ca2+]i values for all clusters at a PO2 level. n= 9 clusters. PO2 at half-maximal Δ[Ca2+]i response was 9.3 mmHg. Curve fit as in Fig. 5.

Similar articles

Cited by

References

    1. Acker H. Mechanisms and meaning of cellular oxygen sensing in the organism. Respiration Physiology. 1994;95:1–10. 10.1016/0034-5687(94)90043-4. - DOI - PubMed
    1. Biscoe TJ, Duchen MR. Responses of type I cells dissociated from the rabbit carotid body to hypoxia. The Journal of Physiology. 1990;428:39–59. - PMC - PubMed
    1. Biscoe TJ, Duchen MR, Eisner DA, O'Neill SC, Valdeolmillos M. Measurements of intracellular Ca2+ in dissociated type I cells of the rabbit carotid body. The Journal of Physiology. 1989;416:421–434. - PMC - PubMed
    1. Biscoe TJ, Purves MJ. Carotid body chemoreceptor activity in the new-born lamb. The Journal of Physiology. 1967;190:443–454. - PMC - PubMed
    1. Blanco CE, Dawes GS, Hanson MA, McCooke HB. The response to hypoxia of arterial chemoreceptors in fetal sheep and new-born lambs. The Journal of Physiology. 1984;351:25–37. - PMC - PubMed

LinkOut - more resources