. 1999 Jan 15;514 ( Pt 2)(Pt 2):515-31.
doi: 10.1111/j.1469-7793.1999.515ae.x.

Identification of rhythmically active cells in guinea-pig stomach

Affiliations

Identification of rhythmically active cells in guinea-pig stomach

E J Dickens et al. J Physiol. .

Abstract

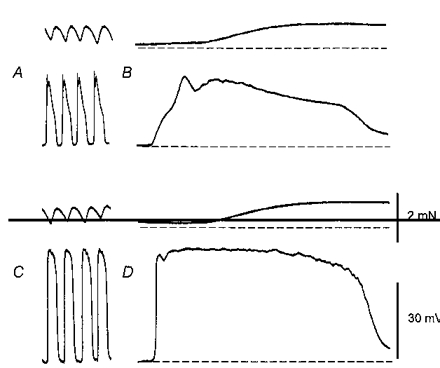
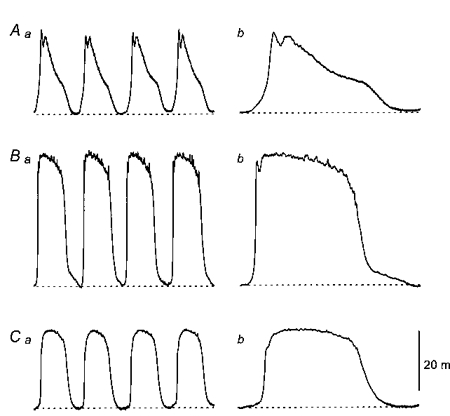
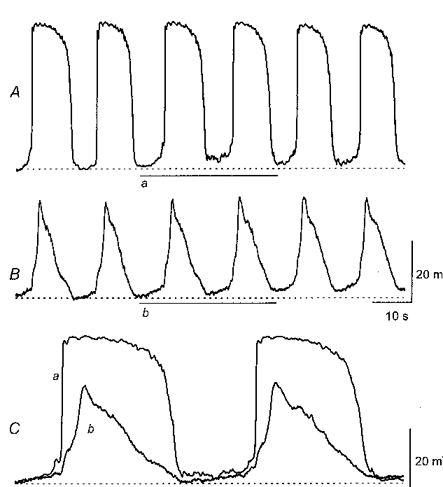
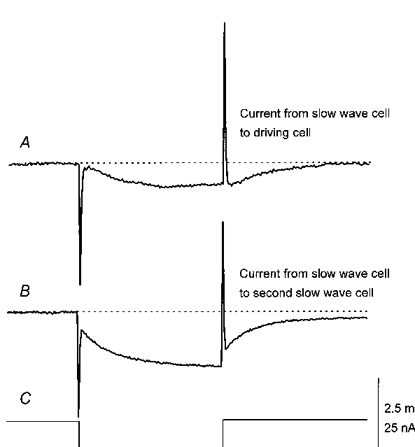
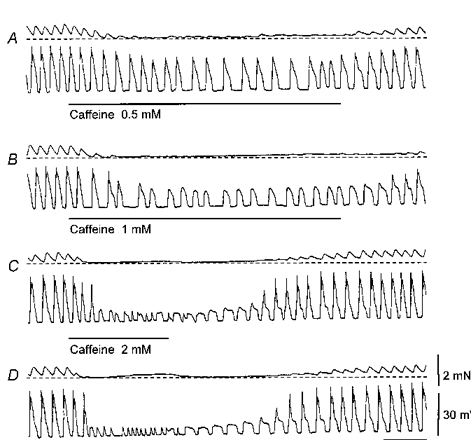
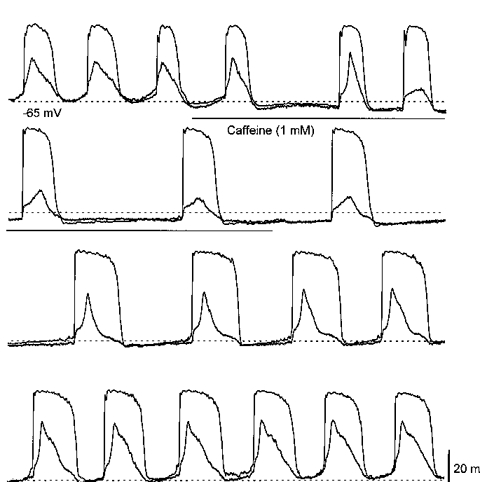
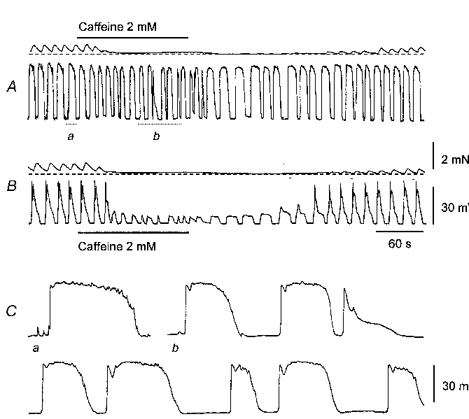
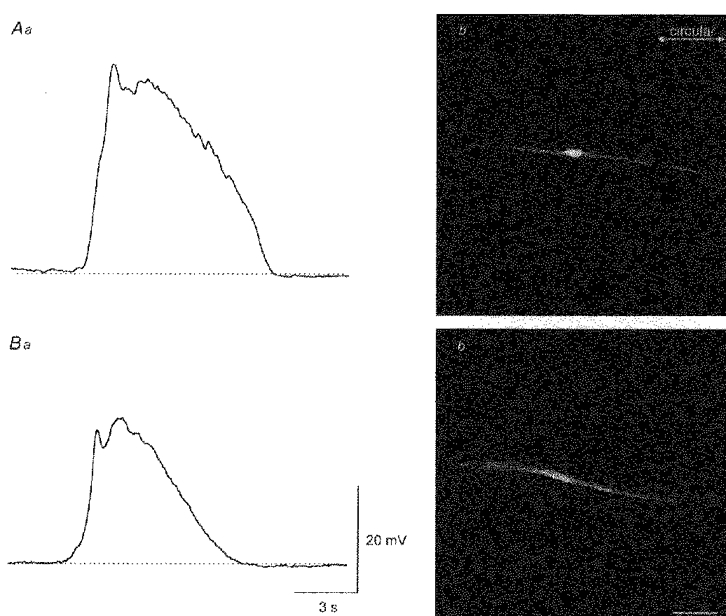
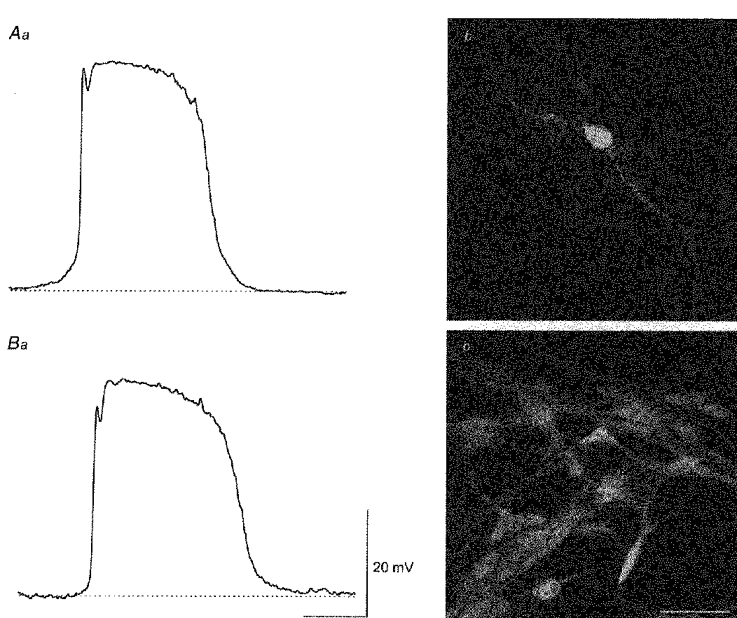
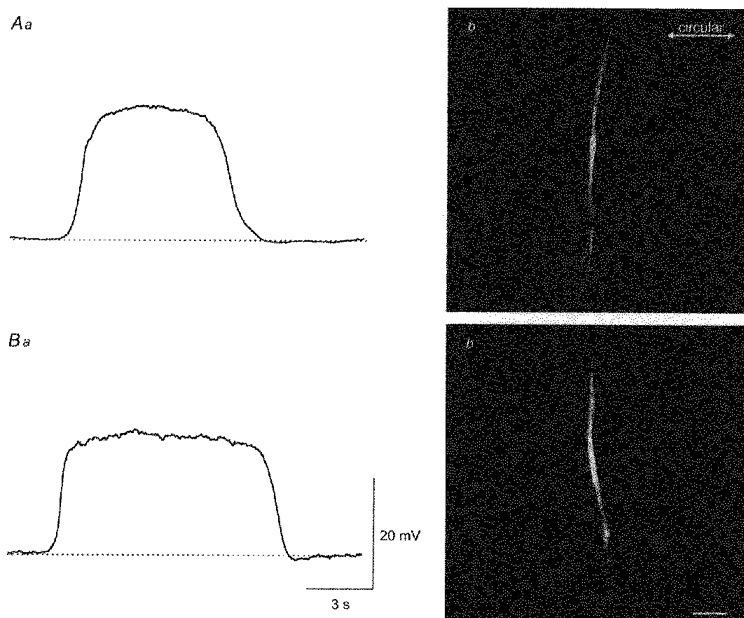
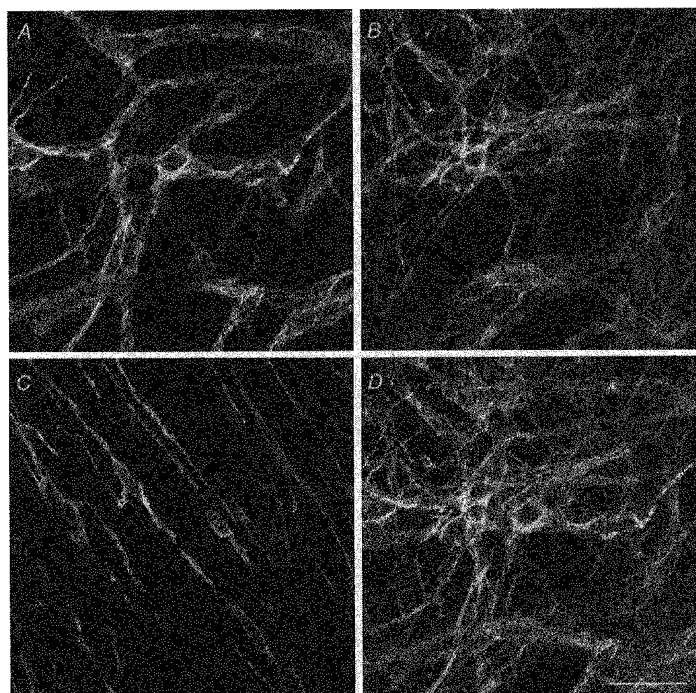
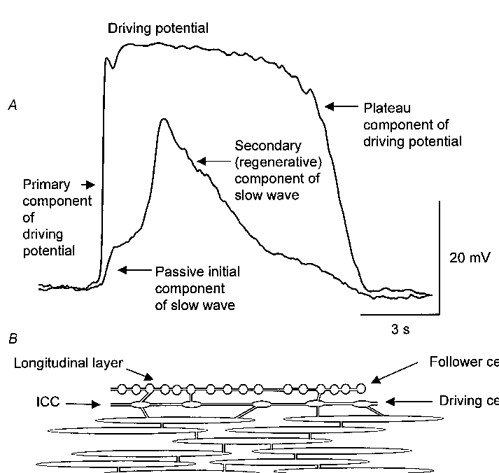
1. When intracellular recordings were made from the antral region of guinea-pig stomach, cells with different patterns of electrical activity were detected. 2. One group of cells, slow-wave cells, generated slow waves which consisted of initial and secondary components. When filled with either Lucifer Yellow or neurobiotin, the cells identified as smooth muscle cells lying in the circular muscle layer. 3. A second group of cells, driving cells, generated large, rapidly rising, potential changes, driving potentials. They had small cell bodies with several processes. With neurobiotin, a network of cells was visualized that resembled c-kit positive interstitial cells of the myenteric region. 4. A third group of cells generated sequences of potential changes which resembled driving potentials but had smaller amplitudes and slow rates of rise. These cells resembled smooth muscle cells lying in the longitudinal muscle layer. 5. When simultaneous recordings were made from the driving and slow-wave cells, driving potentials and slow waves occurred synchronously. Current injections indicated that both cell types were part of a common electrical syncytium. 6. The initial component of slow waves persisted in low concentrations of caffeine, but the secondary component was abolished; higher concentrations shortened the duration of the residual initial component. Driving potentials continued in the presence of low concentrations of caffeine; moderate concentrations of caffeine shortened their duration. 7. Hence three different types of cells were distinguished on the basis of their electrical activity, their responses to caffeine and their structure. These were smooth muscle cells, lying in the longitudinal and circular layers, and interstitial cells in the myenteric region. The observations suggest that interstitial cells initiate slow waves.


Figures

Figure 1
Figure 1. Simultaneous recordings of slow waves, driving potentials and myogenic activity from guinea-pig stomach
The upper pairs of traces, A and B, show recordings of contractions (upper trace) and associated slow waves (lower trace), displayed at two different recording speeds. It can be seen that slow waves occurred at about 2.5 waves min−1 and that each preceded a muscle contraction (A). On an expanded time base, it can be seen that slow waves had initial components and that the maximum contraction occurred during the latter half of each slow wave (B). The lower sets of traces, C and D, show recordings obtained from the same preparation. Large amplitude membrane potential changes occurred, again at about 2.5 waves min−1, each potential change preceded a muscle contraction (C). The maximum contraction occurred during the latter half of the driving potential (D). The force calibration bar applies to each contraction record; the voltage calibration bar applies to each voltage record. The left-hand time calibration bar refers to recordings shown in A and C, the right-hand time calibration refers to recordings shown in B and D.
Figure 2
Figure 2. Different sequences of membrane potential change recorded from slow wave, driving and follower cells lying in the guinea-pig antrum
The upper traces (Aa and Ab) show recordings of slow waves, displayed on two different time bases. The peak negative potential was -64 mV. The middle traces (Ba and Bb) show driving potentials recorded from the same preparation, again displayed on two different time bases. The peak negative potential was -65 mV. The lower traces (Ca and Cb) show membrane potential changes recorded from a follower cell, again recorded from the same preparation and again displayed at two scan speeds. The peak negative potential was -62 mV. The physiological saline contained nifedipine (1 μm). The left-hand time calibration bar applies to the column of recordings shown on the left; the right-hand time-calibration bar applies to the column on the right. The voltage calibration bar applies to all recordings.
Figure 3
Figure 3. Simultaneous recordings of driving potentials and slow waves from two cells in a bundle of circular smooth muscle cells of guinea-pig stomach
The upper traces show simultaneous recordings of driving potentials (A) and slow waves (B). It can be seen that they occurred in phase. Two sequences of potential changes, recorded simultaneously, are overlaid in C. It can be seen that the rapid upstroke of the driving potential is followed by the slower rising phase of the initial component of the slow wave. The physiological saline contained nifedipine (1 μm). The upper time and voltage scale bars apply to traces A and B; the lower time and voltage scale bars apply to overlaid traces C.
Figure 4
Figure 4. Electrical coupling between slow wave and driving cells, and between two slow wave cells
The upper trace (A) shows the electrotonic potential initiated in a driving cell by injecting hyperpolarizing current into a slow wave cell some 300 μm distant. The lower trace (B) shows the electrotonic potential initiated in a smooth muscle cell located just below the driving cell from which trace A was obtained when the same hyperpolarizing currents were injected into the same slow-wave cell. Each membrane potential recording is an average of eight traces, recorded during the resting period between each driving potential/slow wave. The physiological saline contained nifedipine (1 μm). The voltage calibration bar applies to the upper recordings, the current calibration bar applies to the lower current monitor trace (C) and the time calibration bar applies to all recordings.
Figure 5
Figure 5. Effect of caffeine on slow waves and myogenic contractions recorded from guinea-pig stomach
Each pair of traces records contraction (upper) and membrane potential (lower). The addition of caffeine (0.5 mM) reduced the frequency of slow waves and decreased their peak amplitude. Muscle tone was reduced and myogenic contractions almost abolished the phasic contractions associated with each slow wave (A). Increasing the concentration of caffeine (1 mM) completely abolished the phasic contractions and further reduced the frequency and amplitudes of the slow waves (B). A further increase in caffeine concentration (2 mM) reduced the amplitude of the slow waves and revealed a resistant component of constant amplitude. During wash out, the gradual recovery of the second component can be seen (C). The highest concentration of caffeine tested (3 mM) reduced the amplitudes of the slow waves to again give resistant components of constant amplitude. However, the resistant components frequently had brief durations (D). The force calibration bar applies to all contraction records; the voltage calibration bar applies to all membrane potential recordings and the time calibration bar refers to all recordings.
Figure 6
Figure 6. Effect of caffeine on driving potentials and slow waves recorded simultaneously from two cells in the same bundle of circular smooth muscle of guinea-pig stomach
The traces show simultaneous recordings of driving potentials and slow waves during the application and wash out of caffeine (1 mM). Caffeine slowed the rate of generation of slow waves and driving potentials. When the secondary component of the slow wave was abolished, the residual response was seen to continue occurring synchronously with the driving potential. As caffeine was washed out, the secondary component of the slow wave gradually recovered. The duration of the driving potential was transiently increased, at the same time the duration of the initial component of the slow wave was prolonged. The physiological saline contained nifedipine (1 μm). The time and voltage scale bars apply to all traces.
Figure 7
Figure 7. The effect of caffeine on driving potentials and slow waves recorded from the same preparation of guinea-pig stomach
The upper pair of traces show driving potentials and the associated contractions (A). The addition of caffeine (2 mM) shortened the duration and increased the frequency of driving potentials (A). When viewed on expanded time base, giant potentials were seen to consist of a rapid primary component, followed by a plateau (Aa and Ca). In the presence of caffeine the duration of the plateau became variable and on occasions only the primary component persisted (Aa and Cb). Subsequently a cell generating a slow wave was impaled; caffeine (2 mM) now abolished the secondary component of the slow wave to reveal initial components of variable duration (B). The upper scale bars apply to traces A and B. The lower scale bars apply to traces Ca and b.
Figure 8
Figure 8. Morphological properties of slow-wave cells filled with Lucifer Yellow or neurobiotin
The upper membrane potential recording of a slow wave (Aa) was obtained using a microelectrode containing Lucifer Yellow. After appropriate fixation, the preparation was viewed and the shape of the filled cell (Ab) determined using a confocal microscope (composite of a z-series through 9 μm). The lower recording of a slow wave (Ba) was obtained using a microelectrode containing neurobiotin. Subsequently heptanol (3 mM) was added to the physiological saline and neurobiotin injected for 4 min. After appropriate fixation and conjugation with streptavidin-Texas Red, the preparation was viewed and the arrangement of the neurobiotin-loaded cell (Bb) determined using a confocal microscope (composite of a z-series through 12 μm). Note that both cells were orientated in a circular manner. The physiological saline contained nifedipine (1 μm). The time and voltage calibration bars apply to both membrane potential recordings. The calibration bar, 40 μm, applies to both photomicrographs.
Figure 9
Figure 9. Morphological properties of driving cells filled with Lucifer Yellow or neurobiotin
The driving potential shown in the upper trace (Aa) was obtained by using a microelectrode containing Lucifer Yellow. The shape of a driving cell was determined by sectioning through the brightest cell (Ab) with a confocal microscope (composite of a z-series through 19 μm). The lower trace (Ba) shows a driving potential recorded with a microelectrode containing neurobiotin. After identifying the cell, heptanol (3 mM) was added to the physiological saline and neurobiotin injected for 4 min. After appropriate processing the preparation was viewed and the arrangement of the neurobiotin-loaded cells (Bb) determined using a confocal microscope (composite of a z-series through 11 μm). The physiological saline contained nifedipine (1 μm). The time and voltage calibration bars apply to both membrane potential recordings. The calibration bar, 40 μm, applies to both photomicrographs.
Figure 10
Figure 10. Morphological properties of follower cells filled with Lucifer Yellow or neurobiotin
The upper trace (Aa) shows the potential change recorded from a follower cell with a microelectrode containing Lucifer Yellow. The filled cell (Ab) was viewed with a confocal microscope (composite of a z-series through 7 μm). The lower recording (Ba) was obtained using a microelectrode containing neurobiotin. After conjugating with streptavidin-Texas Red, the loaded cell (Bb) was viewed with a confocal microscope (composite of a z-series through 13 μm). Note that both cells were long and thin; both had a longitudinal orientation. The physiological saline contained nifedipine (1 μm). The time and voltage calibration bars apply to both membrane potential recordings. The calibration bar, 40 μm, applies to both photomicrographs.
Figure 11
Figure 11. Distribution of ICC in the myenteric region of guinea-pig stomach shown by staining for c-kit
The figure shows four photomicrographs showing the distribution of cells expressing c-kit in the guinea-pig antrum. The confocal micrograph (A) shows the distribution of c-kit immunoreactive cells in the outer layer of the myenteric region adjacent to the longitudinal muscle layer (composite of a z-series through 2.4 μm). The micrograph (B) shows the distribution of c-kit immunoreactive cells in the lower region of the myenteric region (composite of a z-series through 5 μm). The cell bodies have diameters of some 10-15 μm but as they fail to appear in successive composites, are flattened. The lower myenteric region was invariably denser than the upper layer. Micrograph (C) shows a representative sample of ICC lying in the circular muscle layer (composite of a z-series through 5 μm). Micrograph (D) shows a combined projection of micrographs, A, B and C. The calibration bar of 40 μm applies to each micrograph.
Figure 12
Figure 12. Experimental and schematic representations to explain the generation of slow waves in the circular muscle layer of the guinea-pig stomach
Simultaneous recordings of driving potentials and a slow wave from two cells in a bundle of circular smooth muscle cells of guinea-pig stomach are shown in the upper pair of traces (A); the physiological saline contained nifedipine (1 μm). The primary component of the driving potential causes a rapid membrane potential change which in turn triggers a long lasting plateau component. Driving cells, or ICC, produce a persistent depolarizing current which flows via gap junctions to slow-wave cells, smooth-muscle cells in the circular-muscle layer and to follower cells, smooth-muscle cells in the longitudinal layer (B). A persistent wave of depolarization in the circular muscle layer initiates a secondary, regenerative component in this layer.

Similar articles

Cited by

References

    1. Anderson K-E. Pharmacology of lower urinary tract smooth muscles and penile erectile tissues. Pharmacological Reviews. 1993;45:253–307. - PubMed
    1. Barajas-Lopez C, Berezin I, Daniel EE, Huizinga JD. Pacemaker activity recorded in interstitial cells of Cajal of the gastrointestinal tract. American Journal of Physiology. 1989;257:C830–835. - PubMed
    1. Bauer AJ, Publicover NG, Sanders KM. Origin and spread of slow waves in canine gastric antral circular muscle. American Journal of Physiology. 1985;249:G800–806. - PubMed
    1. Beny JL, Connat JL. An electron-microscopic study of smooth muscle dye coupling in the pig coronary arteries. Role of gap junctions. Circulation Research. 1992;70:49–55. - PubMed
    1. Bornstein JC, Costa M, Furness JB, Lees GM. Electrophysiology and enkephalin immunoreactivity of identified myenteric plexus neurones of guinea-pig small intestine. The Journal of Physiology. 1984;351:313–325. - PMC - PubMed

Publication types

LinkOut - more resources