. 1999 Jan 15;514 ( Pt 2)(Pt 2):551-66.
doi: 10.1111/j.1469-7793.1999.551ae.x.

Topographical organization of projections to cat motor cortex from nucleus interpositus anterior and forelimb skin

Affiliations

Topographical organization of projections to cat motor cortex from nucleus interpositus anterior and forelimb skin

H Jörntell et al. J Physiol. .

Abstract

1. The activation of the motor cortex from focal electrical stimulation of sites in the forelimb area of cerebellar nucleus interpositus anterior (NIA) was investigated in barbiturate-anaesthetized cats. Using a microelectrode, nuclear sites were identified by the cutaneous climbing fibre receptive fields of their afferent Purkinje cells. These cutaneous receptive fields can be identified by positive field potentials reflecting inhibition from Purkinje cells activated on natural stimulation of the skin. Thereafter, the sites were microstimulated and the evoked responses were systematically recorded over the cortical surface with a ball-tipped electrode. The topographical organization in the motor cortex of responses evoked by electrical stimulation of the forelimb skin was also analysed. 2. Generally, sites in the forelimb area of NIA projected to the lateral part of the anterior sigmoid gyrus (ASG). Sites in the hindlimb area of NIA also projected to lateral ASG and in addition to a more medial region. Sites in the face area of NIA, however, projected mainly to the middle part of the posterior sigmoid gyrus (PSG). 3. For sites in the forelimb area of NIA, the topographical organization and strength of the projections varied specifically with the cutaneous climbing fibre receptive field of the site. The largest cortical responses were evoked from sites with receptive fields on the distal or ventral skin of the forelimb. 4. Microelectrode recordings in the depth of the motor cortex revealed that responses evoked by cerebellar nuclear stimulation were due to an excitatory process in layer III. 5. Short latency surface responses evoked from the forelimb skin were found in the caudolateral part of the motor cortex. At gradually longer latencies, responses appeared in sequentially more rostromedial parts of the motor cortex. Since the responses displayed several temporal peaks that appeared in specific cortical regions for different areas of the forelimb skin, several somatotopic maps were seen. 6. The cerebellar and cutaneous projections activated mainly different cortical regions and had topographical organizations that apparently were constant between animals. Their patterns of activation may constitute a frame of reference for investigations of the functional organization of the motor cortex.


Figures

Figure 8
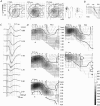
Figure 8. Isopotential maps of cortical responses evoked on peripheral stimulation
A, isopotential maps of response amplitudes at latencies indicated on top left of each map for peripheral stimulation sites shown to the left. Area 4γ and cortical exposure are outlined in all maps; recording points are shown in the top left map only. Triangles indicate illustrated recording point in area 3b; stars indicate illustrated recording points for different temporal peaks in area 4γ. As a reference to the NIA projection, the projection focus of a IIIb site is indicated by a square. Single isopotential lines are drawn for responses evoked from the stimulation sites on the face and hindlimb in the maps. B, sample recordings.
Figure 1
Figure 1. Characteristics of cortical responses evoked on stimulation of cerebellar nuclear sites and the effect of altering electrical stimulation parameters
A, location in the right pericruciate cortex of recording point (star) illustrated in D, E and G. Dashed lines demarcate cytoarchitectonic areas as defined by Hassler & Muhs-Clement (1964). B, cutaneous climbing fibre receptive field of the NIA site stimulated in D, E and G (location in NIA indicated by square in C). Light and dark shading indicate extent and sensitivity centre of the receptive field, respectively. ‘Ie’ refers to the receptive field classification in Fig. 4. C, standardized frontal sections of NIA used to indicate location of NIA sites in this and following figures. D, cortical responses evoked with electrical stimulation parameters indicated to the left and on top. E, stimulus intensity plotted against response amplitude. F, effect of increasing pulse width. Single shock (50 μA) stimulation. G, peak positivity plotted against peak negativity for averages of responses in D. Symbols as in E. H, disappearance of all but the initial part of response (I) was relieved by a small dose of barbiturate (II). Record III was obtained by subtracting record I from II. Thick dashed vertical line drawn for reference. Double shock (30 μA) stimulation. F and H, two different experiments. Calibrations in H apply to D and F. r, rostral; c, caudal; m, medial; l, lateral; cor, coronal sulcus; pcd, postcruciate dimple; cruc, cruciate sulcus; NIP, nucleus interpositus posterior.
Figure 4
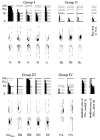
Figure 4. Maximal response amplitudes evoked from different types of NIA sites
Each bar represents the maximal response amplitude evoked from one site (evoked by a 30 μA double shock or, in a few cases, a 50 μA single shock). Amplitudes are expressed as a percentage of the maximal response evoked in the respective experiment (hatched bars represent maximal response amplitudes of hatched foci in Fig. 7). Sites are arranged in groups and subgroups according to the climbing fibre receptive field classification of Garwicz & Ekerot (1994). A sample receptive field is illustrated for each subgroup. Only sites from 10 experiments in which three or more sites were investigated are displayed. No maximal response amplitude was so close to 0 % that its bar representation was concealed by the 0 % line. rfs, receptive fields.
Figure 7
Figure 7. Foci of cortical responses evoked from NIA sites
Display as in Fig. 6 for all sites investigated. For legibility, isopotential lines are only drawn at 90 % of maximal response amplitudes (projection foci). Projection foci of sites with the same type of climbing fibre receptive field are superimposed. Shading indicates multiple foci in isopotential maps of single sites. Hatched foci were considered clearly different from other foci within the respective map and the corresponding nuclear sites are indicated by filled squares.
Figure 2
Figure 2. Cortical responses evoked from electrode track through NIA
Thick grey line represents outline of area 4γ and the cruciate sulcus. The cortical recording point (indicated by a star) was located in the projection focus (see below) of the NIA site with receptive field indicated at bottom left. Crosses indicate stimulated sites along microelectrode track through NIA (thin outline in the middle of figure, see key in Fig. 1C). Radii of empty circles are proportional to the amplitudes of the evoked cortical responses shown to the right (stimulus intensity, 50 μA; shock artefacts truncated by the graphing software).
Figure 3
Figure 3. Field potentials evoked in the depth of the cortex on stimulation of a NIA site
A, isopotential maps of responses evoked at the surface. Potentials were measured at the fixed latencies indicated in the top left corner of each map. Insertion points of microelectrode tracks are indicated by circles numbered from 1 to 7. Area 4γ and the cortical exposure are outlined by semithick lines. The climbing fibre receptive field of the stimulated site, its classification and its location in NIA (see key in Fig. 1C) are shown to the right. B, key to D. Microelectrode tracks are indicated in a schematic sagittal section of the motor cortex (see A). Continuous line indicates border between layers I and II; dashed line indicates border between layers III and V. Thin horizontal lines indicate depths as in D. C, recordings from one track. Thick dashed lines indicate latencies illustrated in D. D, isopotential maps of amplitudes measured at the latencies indicated in top left corner of each map. Recording points were separated vertically by 250 μm or less. Empty circles indicate track insertions; arrowheads indicate track illustrated in C. Open bars indicate the cruciate sulcus as in B. PSG, posterior sigmoid gyrus.
Figure 5
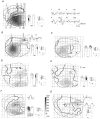
Figure 5. Isopotential maps of cortical responses evoked on stimulation of NIA sites
In A-G, isopotential maps of cortical responses are shown to the left. Climbing fibre receptive fields of stimulated sites, their classification and location in NIA are shown to the right. Outlines of cortical exposure and of area 4γ are shown with semithick lines. Sample distributions of recording points are indicated by circles in A. Roman numerals in A and B refer to recording points, indicated by stars, from which sample recordings were taken. Same calibrations for all recordings. The data of the following maps were obtained in the same experiments: A and F, B and C, and D and E.
Figure 6
Figure 6. Comparison of isopotential maps of cortical responses evoked from forelimb sites in NIA
Cortical projections from different NIA sites are represented by isopotential lines drawn at 30, 70 and 90 % of their maximal evoked responses (the 30 % level is left out for one site since its low voltage was too close to baseline noise). Outline represents border of area 4γ and the cruciate sulcus. Column alignment indicates group or subgroup identity of stimulated sites according to heading. Symbols at the top left of each map denote sites from same experiments. Maximal response amplitudes are also given at the top. Beneath maps, nuclear locations of sites are indicated (see key in Fig. 1C). Open isopotential lines rostrally indicate extent outside the exposed cortical area. Crosses corresponding to the Ia focus are given for reference.
Figure 9
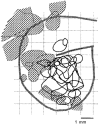
Figure 9. Distribution of cortical responses evoked from forelimb sites in NIA and from peripheral skin sites
Thick black lines indicate projection foci for all forelimb sites of NIA (see Fig. 7). Hatched areas correspond to the spatiotemporal peaks of skin sites on the forelimb and face as illustrated in Fig. 8. To reveal the double peaks at the longest latencies, projection foci of the peripheral input were drawn at 80 % of the maximal response amplitude at each latency.

Similar articles

Cited by

References

    1. Andersson G. Regional differences in evoked response latencies in the cat motor cortex (area 4γ) Acta Physiologica Scandinavica. 1986;127:395–405. - PubMed
    1. Andersson G. Cortico-cortical mediation of short-latency (lemniscal) sensory input to the motor cortex in deeply pentobarbitone anaesthetized cats. Acta Physiologica Scandinavica. 1995;153:381–392. - PubMed
    1. Armand J. Topical versus diffuse organization of the corticospinal tract in the cat. Journal de Physiologie. 1978;74:227–230. - PubMed
    1. Armand J, Kuypers H G J M. Cells of origin of crossed and uncrossed corticospinal fibres in the cat. A quantitative horseradish peroxidase study. Experimental Brain Research. 1980;40:23–34. - PubMed
    1. Asanuma H, Arnold A, Zarzecki P. Further study on the excitation of pyramidal tract cells by intracortical microstimulation. Experimental Brain Research. 1976;26:443–461. - PubMed

Publication types

LinkOut - more resources