. 1998 Dec 15;18(24):10409-19.
doi: 10.1523/JNEUROSCI.18-24-10409.1998.

Postsynaptic Ca2+ influx mediated by three different pathways during synaptic transmission at a calyx-type synapse

Affiliations

Postsynaptic Ca2+ influx mediated by three different pathways during synaptic transmission at a calyx-type synapse

J H Bollmann et al. J Neurosci. .

Abstract

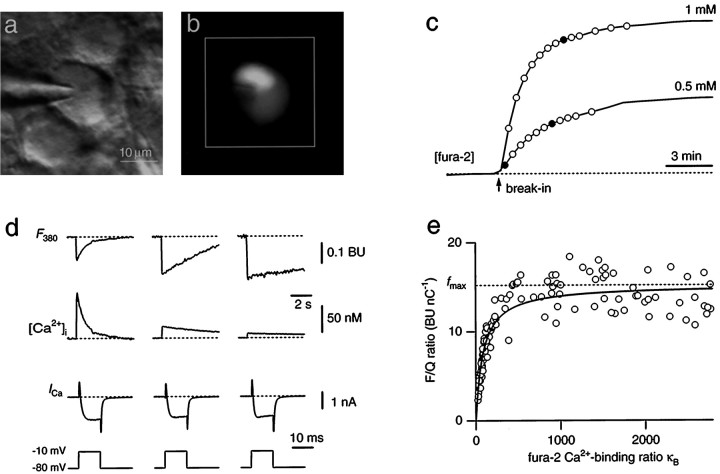
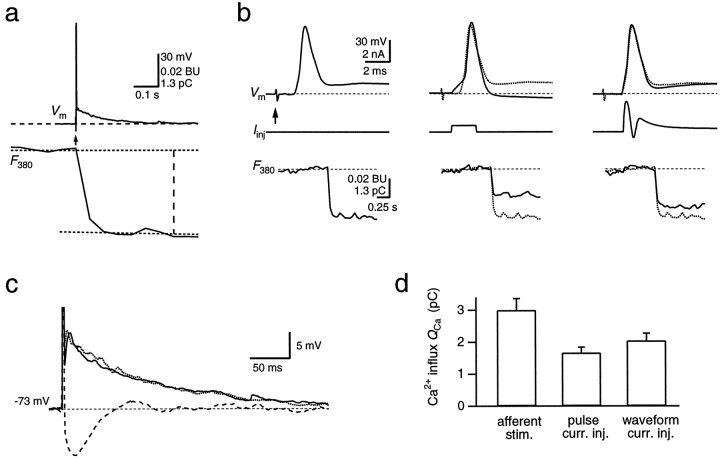
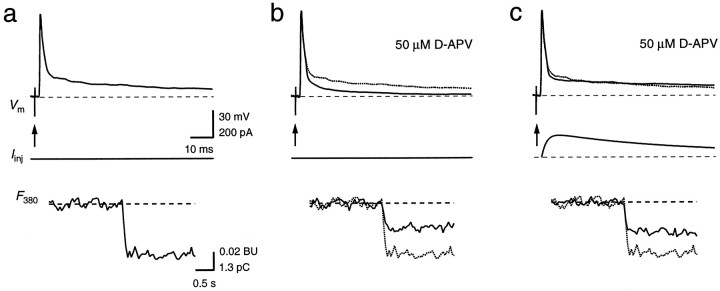
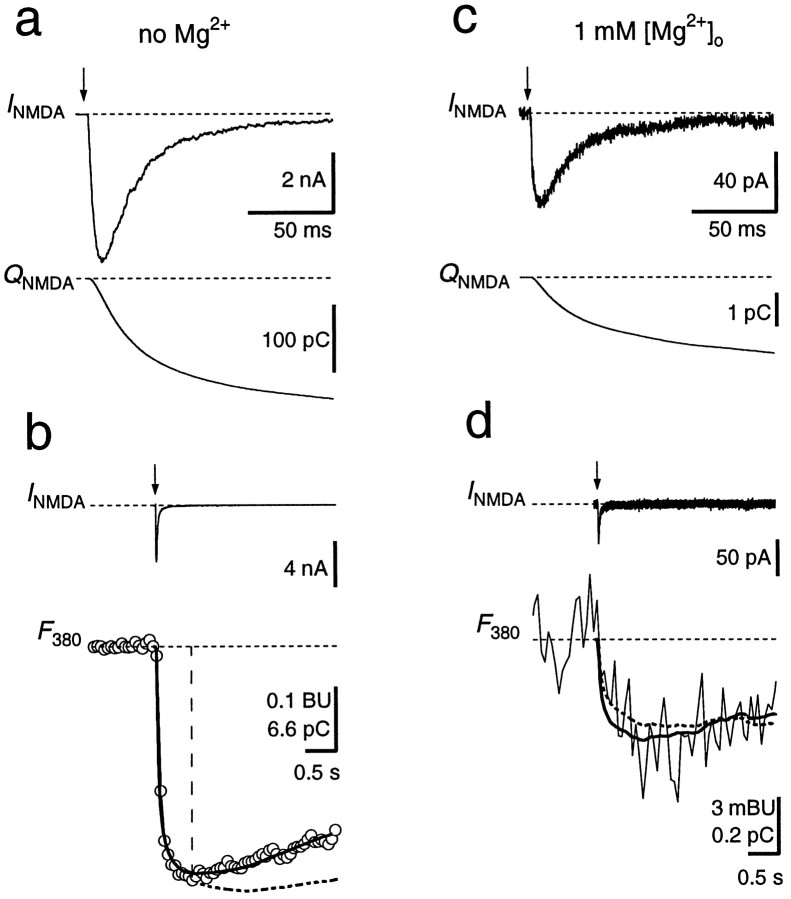
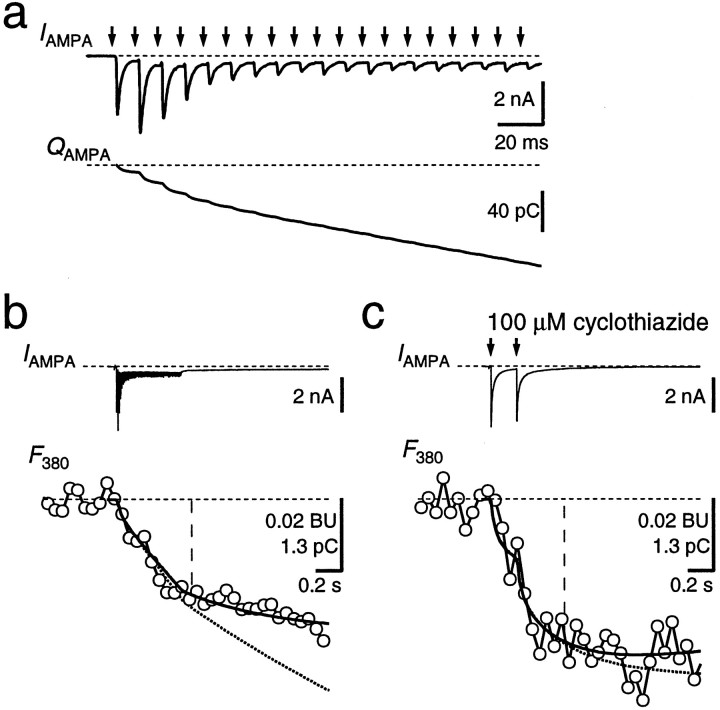
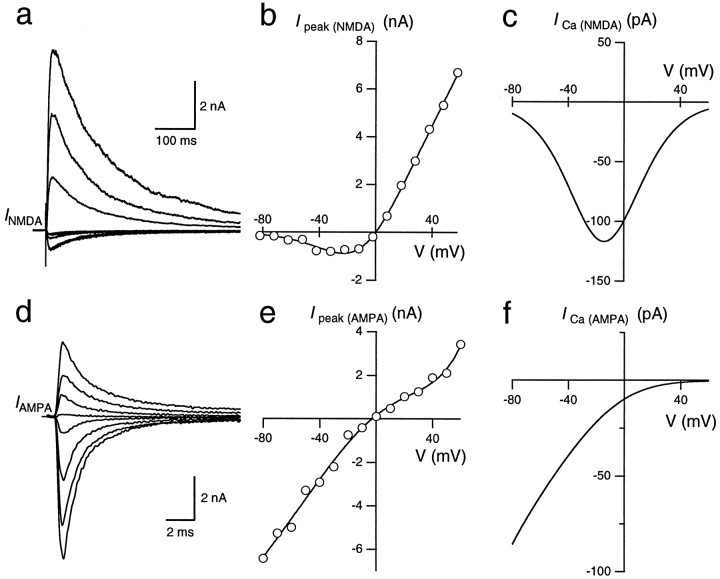
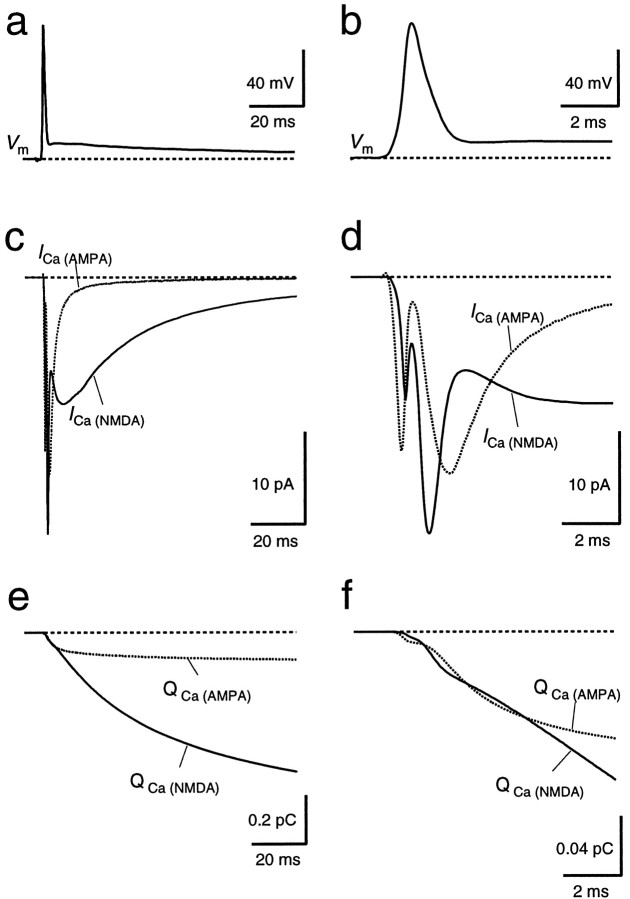
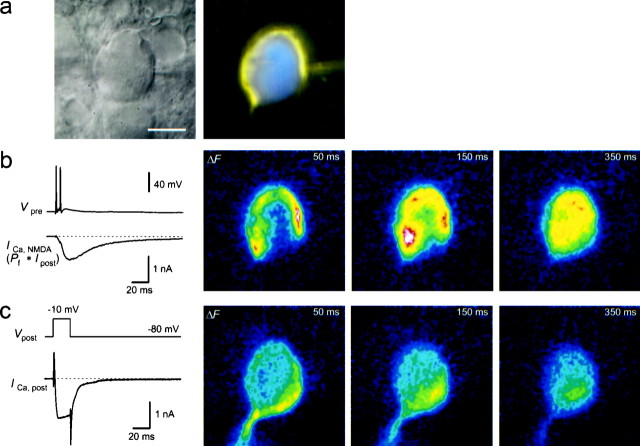
Whole-cell recordings and Ca2+ flux measurements were made at a giant calyx-type synapse in rat brainstem slices to determine the contribution of glutamate receptor (GluR) channels and voltage-dependent Ca2+ channels (VDCCs) to postsynaptic Ca2+ influx during synaptic transmission. A single presynaptic action potential (AP) evoked an EPSP, followed by a single AP. The EPSP-AP sequence caused a postsynaptic Ca2+ influx of approximately 3.0 pC, primarily through VDCCs ( approximately 70%) and NMDA-type (up to 30%) channels but also through AMPA-type (<5%) GluR channels. At -80 mV, the fractional Ca2+ current (Pf) mediated by AMPA receptor (AMPAR) and NMDA receptor (NMDAR) channels was 1.3 and 11-12%, respectively. Simulations of the time course of Ca2+ influx through GluR channels suggested that the small contribution of AMPAR channels occurred only during the first few milliseconds of an EPSP, whereas influx through NMDAR channels dominated later. The NMDAR-mediated Ca2+ influx was localized in regions covered by the presynaptic terminal, whereas the Ca2+ influx mediated by VDCCs was more homogeneously distributed. Because of the temporal and spatial differences, calcium ions entering through the three different pathways are likely to activate different intracellular targets in the postsynaptic cell.


Figures

Fig. 1.
Fig. 1.
Combined whole-cell recordings and fura-2 measurements from MNTB neurons. a, Infrared video image of a MNTB principal neuron with a whole-cell patch pipette.b, Fluorescence image of the same neuron filled with 1 mm fura-2. The white square indicates the region on the CCD chip from which average fluorescence signals were measured. c, Two examples of loading an MNTB neuron with 0.5 and 1 mm fura-2, respectively. The fura-2 concentration was monitored at the Ca2+-insensitive excitation wavelength (solid lines). It was assumed that the concentration of fura-2 in the pipette and the cell were the same when the fluorescence intensity reached a plateau level. During fura-2 loading, Ca2+ currents were evoked by 10 msec depolarizing voltage steps from −80 to −10 mV in 30–60 sec intervals (circles). d, Examples of fluorescence decrements at 380 nm excitation (F380) evoked by brief Ca2+ currents (ICa). Traces are from the loading experiments shown in c at the times indicated by thefilled circles. Assuming equilibrium with the patch pipette concentration when the fluorescence reached a plateau level, the intracellular fura-2 concentration was 60 (left), 330 (middle), and 880 μm(right). Fluorescence decrements are expressed in bead units and were ratiometrically converted to changes in Ca2+ concentration ([Ca2+]i). Note differences in time scale. e, Summary plot of the dependence of the F/Q ratio on the fura-2 Ca2+-binding ratio κB. Data points are from 13 loading experiments using different fura-2 pipette concentrations ranging between 50 μm and 1 mm. A curve according to Equation 1 was fitted to the data with fmax held constant at 15.2 BU/nC andκS as the free parameter in the fitting procedure.
Fig. 2.
Fig. 2.
Ca2+ influx during a suprathreshold EPSP. a, A single postsynaptic AP (top, Vm) in an MNTB principal neuron evoked by afferent stimulation (arrow) displays a fast spike and a slowly decaying afterpotential. The simultaneously recorded fluorescence change (F380) on the same time scale was analyzed ∼400 msec after stimulation, as indicated by thevertical dashed line. It was evaluated as the difference between the fluorescence baseline and a straight line fit to the first 20 sample points after the fluorescence decrease.F380 is an average of eight sweeps. The decrement is expressed in bead units, as well as in picocoulombs, after conversion to Ca2+ charge. b, Single APs were evoked by either afferent stimulation (left,arrow), a rectangular current injection pulse (middle; 300 pA for 2 msec), or a waveform current injection (right). Membrane potential (Vm), the injected current (Iinj), and the simultaneously measured fluorescence intensity (F380) are shown. Note the different time scale of the fluorescence record. For comparison, the voltage trace and F380measured with the afferent stimulation protocol (dotted traces, middle and right) are overlaid with the traces measured by the current injection protocols. The different stimulation protocols were applied in cyclic order.c, Slow afterpotential of the postsynaptic APs evoked by afferent stimulation (dotted trace) and current waveform injection (solid trace) and the pronounced afterhyperpolarization following an AP evoked by a rectangular current pulse (dashed trace) shown on an expanded voltage scale. The peaks of the APs are truncated. d, Comparison of the Ca2+ charge entering the soma during single APs, which were evoked using the three different stimulation protocols.
Fig. 3.
Fig. 3.
Contribution of NMDAR channels to the Ca2+ influx during a suprathreshold EPSP. Single APs in a principal neuron were evoked by afferent stimulation alone (a, b, arrows) or by a combination of afferent stimulation and current waveform injection (c). In b and c, NMDAR channels were blocked with 50 μmd-APV. The AP (Vm) and the fluorescence intensity (F380) of a are shown also in b and c for comparison (dotted traces). ΔF380 inb and c corresponded to 53 and 59%, respectively, of the total ΔF380 in control conditions. Note the different time scale of the fluorescence traces. Calibration bars in a also apply tob and c.
Fig. 4.
Fig. 4.
Fractional Ca2+ current through NMDAR channels. a, A single NMDAR-mediated EPSC (INMDA) and the current integral (QNMDA) at a holding potential of −80 mV in Mg2+-free solution. b, Same EPSC as in a but displayed on a longer time scale, together with the fluorescence trace (F380,open circles) measured simultaneously (1 mmfura-2). F380 is given in bead units, as well as in picocoulombs, after conversion to Ca2+charge. Pf was determined by scalingQNMDA (dashed curve) to fit the time course of F380 within the first 0.6 sec after stimulation (vertical dashed line). The scaling factor in this example was 0.111. Alternatively, a curve accounting for Ca2+ extrusion (see Materials and Methods) was fitted to the entire fluorescence trace, yieldingPf of 11.7% (solid curve).c, NMDAR-mediated EPSC recorded in the same cell as ina and b but with 1 mmMg2+ in the external solution, at −80 mV.d, Pf was 9.7% as determined by scaling of QNMDA (dashed curve) and 11.5% when a curve was fitted to the entire trace (solid curve). F380 and the scaled QNMDA are averages of 10 sweeps. AMPARs were blocked with 10 μm NBQX. Afferent stimulation is indicated by arrows. Stimulus artifacts were blanked.
Fig. 5.
Fig. 5.
Fractional Ca2+ current through AMPAR channels. a, Afferent stimulation for 500 msec at 100 Hz (arrows) evoked a train of EPSCs (IAMPA). Holding potential was −80 mV. In this case, the second EPSC facilitated, whereas the subsequent EPSCs displayed strong depression. The current integral (QAMPA) is shown in thebottom. Stimulus artifacts were blanked.b, Same current trace as in a shown on a longer time scale (IAMPA,top), together with the associated fluorescence (F380, open circles). ThePf was determined by scalingQAMPA (bottom, dotted trace) to fit F380 within the time window indicated by the vertical line, yieldingPf of 0.83% in this example. A curve fit to the F380 trace according to Equation 4 (see Materials and Methods) resulted in Pf of 0.85% (solid curve). Traces are an average of 12 sweeps. c, In the presence of cyclothiazide (100 μm) to minimize AMPAR desensitization, two AMPAR-mediated EPSCs (interstimulus interval, 200 msec) evoked a measurable Ca2+ influx. Different cell from aand b. Pf was 1.3% with both analysis methods. Traces are an average of four sweeps.
Fig. 6.
Fig. 6.
Current–voltage relationships of GluR channels. a, NMDAR-mediated EPSCs were measured at holding potentials ranging from −80 to +60 mV in 10 mV steps. Every second trace is shown. AMPARs were blocked by NBQX. b, The voltage dependence of the peak current through NMDAR channels was fitted according to a Woodhull model (Woodhull, 1973; see Materials and Methods, Eq. 3). c, The voltage dependence of the peak Ca2+ current through NMDAR channels (ICa(NMDA)) was calculated by multiplying the I–V shown in b withPf (V), which was obtained from the Pf value measured at −80 mV and calculated for other membrane potentials assuming a GHK model (see Materials and Methods). d, AMPAR-mediated EPSCs at holding potentials of −80 to +60 mV in 10 mV steps. Every second trace is shown. NMDARs were blocked by d-APV.e, The voltage dependence of the peak current through AMPAR channels was fitted using a fifth-order polynom. The filling solution of the whole-cell recording pipette included 100 μm spermine. f, The voltage dependence of the peak Ca2+ current through AMPAR channels (ICa(AMPA)) was calculated analogous toc.
Fig. 7.
Fig. 7.
Simulated time course of Ca2+influx through NMDAR and AMPAR channels during a suprathreshold EPSP.a, b, The time course of Ca2+ influx through AMPAR and NMDAR channels was calculated using an average of postsynaptic APs evoked by afferent stimulation from 18 cells as a voltage template (Vm). The AP is shown in aand on an expanded time scale in b. c,d, The simulated Ca2+ currents through AMPAR channels (ICa(AMPA),dotted line) and through NMDAR channels (ICa(NMDA), solid line) are shown in c and on an expanded time scale ind. The Ca2+ current traces were calculated using the Ca2+ I–V (Fig.6c,f) to obtain the peak Ca2+ current for each point of the voltage template. Then, the resulting Ca2+ current traces were scaled by the normalized conductance time course of GluR channels as determined from AMPAR- and NMDAR-mediated EPSCs. Integration of the respective Ca2+ current traces yielded the time course of Ca2+ charge (e andf, QCa(AMPA),QCa(NMDA)).
Fig. 8.
Fig. 8.
Localization of postsynaptic Ca2+ entry through NMDAR channels and VDCCs.a, Infrared video image (left) of an MNTB synapse from which a simultaneous presynaptic and postsynaptic recording was done. The presynaptic terminal was loaded with MagFura-2 (0.4 mm) by the pipette on the right, and the postsynaptic neuron was loaded with OGB-5N (0.4 mm). The right image shows the overlay of the presynaptic and postsynaptic fluorescence images (MagFura-2 pseudocolor code,yellow; OGB-5N pseudocolor code, blue). Scale bar, 10 μm. b, Two presynaptic APs (Vpre) elicited by afferent stimulation evoked a large NMDAR-mediated postsynaptic current at the synapse shown in a at a holding potential of −80 mV in Mg2+-free extracellular solution. The estimated Ca2+ current through NMDAR channels is shown below, assuming a Pf of 11.6% (ICa,NMDA). AMPARs were blocked by 10 μm NBQX. The average prestimulus fluorescence image was subtracted to obtain difference images (ΔF,right images), which represent the postsynaptic fluorescence changes of OGB-5N. ΔF images are shown at ∼50, 150, and 350 msec after afferent stimulation, at times when the total accumulated Ca2+ charge was 24, 44, and 55 pC, respectively. White corresponds to the largest fluorescence change. c, In the same MNTB neuron as shown in a and b, voltage steps from −80 to −10 mV (Vpost) evoked a large inward Ca2+ current (ICa,post) in the presence of TTX and TEA to block Na+ and K+ currents. On the right, OGB-5N difference images (ΔF) after subtraction of the prestimulus image are shown at ∼50, 150, and 350 msec after stimulation. Total accumulated Ca2+ charge was ∼40 pC.

References

    1. Banks MI, Smith PH. Intracellular recordings from neurobiotin-labeled cells in brain slices of the rat medial nucleus of the trapezoid body. J Neurosci. 1992;12:2819–2837. - PMC - PubMed
    1. Barnes-Davies M, Forsythe ID. Pre- and postsynaptic glutamate receptors at a giant excitatory synapse in rat auditory brainstem slices. J Physiol (Lond) 1995;488:387–406. - PMC - PubMed
    1. Bito H, Deisseroth K, Tsien RW. Ca2+-dependent regulation in neuronal gene expression. Curr Opin Neurobiol. 1997;7:419–429. - PubMed
    1. Bliss TVP, Collingridge GL. A synaptic model of memory: long-term potentiation in the hippocampus. Nature. 1993;361:31–39. - PubMed
    1. Borst JGG, Sakmann B. Calcium influx and transmitter release in a fast CNS synapse. Nature. 1996;383:431–434. - PubMed

Publication types

MeSH terms

LinkOut - more resources