. 1998 Dec 21;188(12):2215-24.
doi: 10.1084/jem.188.12.2215.

The transcription factor early growth response 1 (Egr-1) advances differentiation of pre-B and immature B cells

Affiliations

The transcription factor early growth response 1 (Egr-1) advances differentiation of pre-B and immature B cells

A Dinkel et al. J Exp Med. .

Abstract

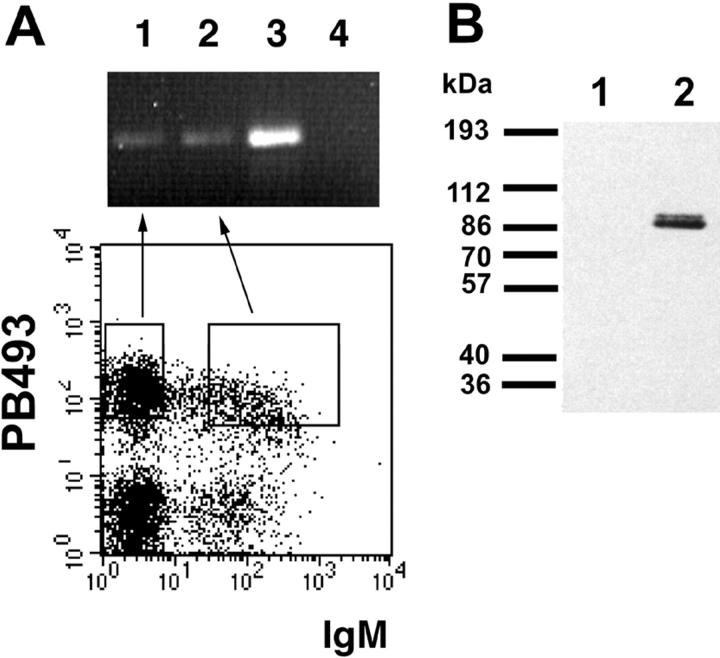
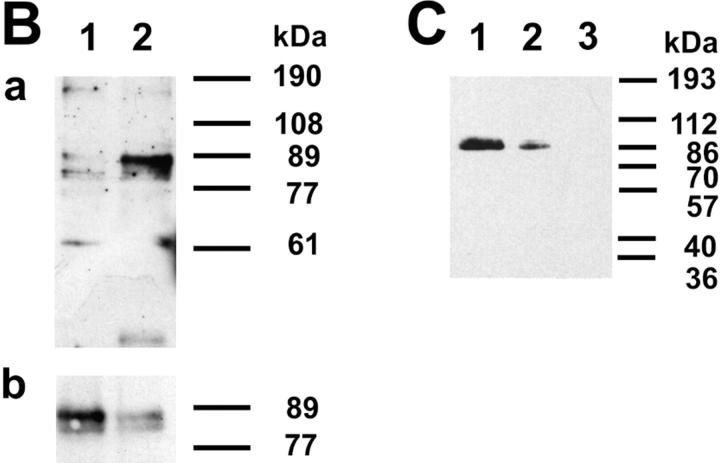
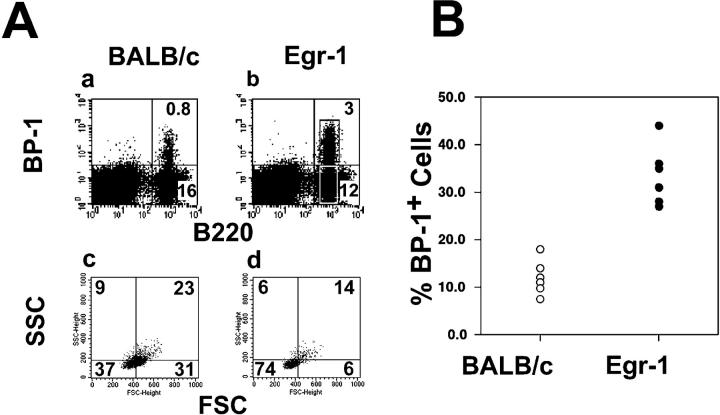
In mature B lymphocytes, the zinc finger transcription factor early growth response 1 (Egr-1) is one of the many immediate-early genes induced upon B cell antigen receptor engagement. However, its role during earlier stages of lymphopoiesis has remained unclear. By examining bone marrow B cell subsets, we found Egr-1 transcripts in pro/pre-B and immature B lymphocytes, and Egr-1 protein in pro/pre-B-I cells cultivated on stroma cells in the presence of interleukin (IL)-7. In recombinase-activating gene (RAG)-2-deficient mice overexpressing an Egr-1 transgene in the B lymphocyte lineage, pro/pre-B-I cells could differentiate past a developmental block at the B220(low) BP-1(-) stage to the stage of B220(low) BP-1(+) pre-B-I cells, but not further to the B220(low) BP-1(+) CD25(+) stage of pre-B-II cells. Therefore, during early B lymphopoiesis progression from the B220(low) BP-1(-) IL-2R- pro/pre-B-I stage to the B220(low) BP-1(+) IL-2R+ pre-B-II stage seems to occur in at least two distinct steps, and the first step to the stage of B220(low) BP-1(+) pre-B-I cells can be promoted by the overexpression of Egr-1 alone. Wild-type mice expressing an Egr-1 transgene had increased proportions of mature immunoglobulin (Ig)M+ B220(high) and decreased proportions of immature IgM+ B220(low) bone marrow B cells. Since transgenic and control precursor B cells show comparable proliferation patterns, overexpression of Egr-1 seems also to promote entry into the mature B cell stage. Analysis of changes in the expression pattern of potential Egr-1 target genes revealed that Egr-1 enhances the expression of the aminopeptidase BP-1/6C3 in pre-B and immature B cells and upregulates expression of the orphan nuclear receptor nur77 in IgM+ B cells.


Figures

Figure 1
Figure 1
Expression of Egr-1 during different stages of B cell maturation. (A) Egr-1 RNA expression. Bone marrow cells of a 5-wk-old BALB/c mouse were stained for B220, PB493, and IgMa expression. Pro/pre-B cells (B220low, PB493+, and IgM) and immature B cells (B220low, PB493+, and IgM+) were sorted and RNA was extracted. Analysis of Egr-1 transcripts by reverse transcription PCR was performed as described by Miyazaki (35). Lane 1 shows expression of Egr-1 in pro/ pre-B cells and lane 2 in immature B cells. Anti-IgM–stimulated splenocytes (lane 3) serve as a positive control. In lane 4, cDNA was omitted from the PCR. (B) Expression of Egr-1 protein. BALB/c fetal liver B cells (day 16) were cultivated in the presence of IL-7 on ST-2 stroma cells. Cellular lysates of 106 cells were examined for Egr-1 expression by immunoblotting using the Egr-1–specific antibody C19 and developed with horseradish peroxidase–coupled goat anti–rabbit IgG. In cultivated pre-B cells, Egr-1 protein expression is easily detected (lane 2). As a negative control an equal amount of ST-2 feeder cells was loaded in lane 1.
Figure 2
Figure 2
Expression of transgenic Egr-1. (A) Comparison of Egr-1 mRNA levels in BALB/c and Egr-1 transgenic spleen cells. RNA was extracted from splenocytes, and Northern blot analysis was performed using a probe specific for endogenous and recombinant Egr-1 mRNA. Because the endogenous and transgenic Egr-1 mRNA species migrate with different electrophoretic mobilities, they are easily identified on Northern blots (data not shown). To standardize for the amounts of mRNA, filters were rehybridized with a GAPDH-specific probe. The relative intensity of the Egr-1 expression in BALB/c and in four transgenic lines IA7, IB10, IC4, and ID4 was determined using a PhosphorImager (Molecular Dynamics, Sunnyvale, CA). (B) Expression of Egr-1 protein in B cells of the bone marrow. B220+ B cells were purified from the bone marrow of three BALB/c and three ID4 transgenic mice using streptavidin-loaded magnetic beads and the B220-specific, biotinylated antibody RA3.3A1. Whole cell lysates with equal amounts of protein were analyzed for Egr-1 expression by immunoblotting using the Egr-1–specific antibody C-19 (a). Lane 1 shows Egr-1 expression in BALB/c bone marrow cells, lane 2 in ID4 mice. In parallel, samples were stained with a horseradish peroxidase–conjugated goat anti–mouse IgM antibody to standardize for the different amounts of protein loaded per lane (b). (C) Increased expression of Egr-1 protein in transgenic pre-B cells. Pre-B cell cultures and immunoblots were performed as described for Fig. 1 B. Transgenic pre-B cells (IA7, lane 1) express higher levels of Egr-1 than an equal amount of wild-type BALB/c pre-B cells (lane 2). Egr-1 protein is undetectable in whole cell lysates of corresponding numbers of ST-2 feeder cells (lane 3).
Figure 2
Figure 2
Expression of transgenic Egr-1. (A) Comparison of Egr-1 mRNA levels in BALB/c and Egr-1 transgenic spleen cells. RNA was extracted from splenocytes, and Northern blot analysis was performed using a probe specific for endogenous and recombinant Egr-1 mRNA. Because the endogenous and transgenic Egr-1 mRNA species migrate with different electrophoretic mobilities, they are easily identified on Northern blots (data not shown). To standardize for the amounts of mRNA, filters were rehybridized with a GAPDH-specific probe. The relative intensity of the Egr-1 expression in BALB/c and in four transgenic lines IA7, IB10, IC4, and ID4 was determined using a PhosphorImager (Molecular Dynamics, Sunnyvale, CA). (B) Expression of Egr-1 protein in B cells of the bone marrow. B220+ B cells were purified from the bone marrow of three BALB/c and three ID4 transgenic mice using streptavidin-loaded magnetic beads and the B220-specific, biotinylated antibody RA3.3A1. Whole cell lysates with equal amounts of protein were analyzed for Egr-1 expression by immunoblotting using the Egr-1–specific antibody C-19 (a). Lane 1 shows Egr-1 expression in BALB/c bone marrow cells, lane 2 in ID4 mice. In parallel, samples were stained with a horseradish peroxidase–conjugated goat anti–mouse IgM antibody to standardize for the different amounts of protein loaded per lane (b). (C) Increased expression of Egr-1 protein in transgenic pre-B cells. Pre-B cell cultures and immunoblots were performed as described for Fig. 1 B. Transgenic pre-B cells (IA7, lane 1) express higher levels of Egr-1 than an equal amount of wild-type BALB/c pre-B cells (lane 2). Egr-1 protein is undetectable in whole cell lysates of corresponding numbers of ST-2 feeder cells (lane 3).
Figure 3
Figure 3
Egr-1 induces development of BP-1+ B220low pre-B cells. Bone marrow cells of IA7 transgenic mice with a RAG-2 background and control littermates were stained with BP-1– and B220-specific antibodies and analyzed by flow cytometry. Dead cells were excluded by gating for propidium iodide–negative cells, and 5 × 10⁴ cells were acquired according to their forward/side scatter (FSC, SSC) profile. As shown for one individual example in A, IA7 mice (b) have about three times more BP-1+ cells than control littermates (a). Changes in the forward/side scatter pattern document that most of the B220+ BP-1+ cells (74% small cells, d) are smaller than the majority of BP-1 cells (37% small and 54% large cells, c). B compiles the BP-1 staining pattern for six RAG-2–deficient IA7 mice and six control littermates.
Figure 4
Figure 4
Higher frequency of mature and lower frequency of immature bone marrow B cells in Egr-1 transgenic mice. (A) Compares the differences between the B220low IgM+ (immature) and B220high IgM+ (mature) B cell subsets of control littermates and transgenic mice. Bone marrow cells of 4–40-wk-old BALB/c littermates (n = 23) and of IA7 transgenic mice (n = 23) were stained for IgM (RS3.1) and B220 (RA3-6B2) and analyzed by flow cytometry after acquisition of 3 × 10⁴ cells gated according to their forward/side scatter profile. The first diagram (a) compares the changes in the percentage of immature IgM+ B220low cells between age-matched BALB/c littermates (open circles) and IA7 mice (filled circles) over a period of 36 wk. P values <0.05 corresponding to the individual time points indicate statistically significant differences between transgenic and control mice. The second diagram (b) shows the increase in the percentage of mature IgM+ B220high cells in older mice. Although transgenic IA7 mice tend to have more mature bone marrow B cells, they do not show the statistically significant differences seen for the immature B cells. (B) Two individual examples of a BALB/c littermate (a) and an IA7 transgenic mouse (b) at 18 wk. The numbers indicate the percentage of B220+ cells in each subset. Similar analyses of bone marrow B cells from the IB10 and ID4 transgenic mice showed almost identical results.
Figure 4
Figure 4
Higher frequency of mature and lower frequency of immature bone marrow B cells in Egr-1 transgenic mice. (A) Compares the differences between the B220low IgM+ (immature) and B220high IgM+ (mature) B cell subsets of control littermates and transgenic mice. Bone marrow cells of 4–40-wk-old BALB/c littermates (n = 23) and of IA7 transgenic mice (n = 23) were stained for IgM (RS3.1) and B220 (RA3-6B2) and analyzed by flow cytometry after acquisition of 3 × 10⁴ cells gated according to their forward/side scatter profile. The first diagram (a) compares the changes in the percentage of immature IgM+ B220low cells between age-matched BALB/c littermates (open circles) and IA7 mice (filled circles) over a period of 36 wk. P values <0.05 corresponding to the individual time points indicate statistically significant differences between transgenic and control mice. The second diagram (b) shows the increase in the percentage of mature IgM+ B220high cells in older mice. Although transgenic IA7 mice tend to have more mature bone marrow B cells, they do not show the statistically significant differences seen for the immature B cells. (B) Two individual examples of a BALB/c littermate (a) and an IA7 transgenic mouse (b) at 18 wk. The numbers indicate the percentage of B220+ cells in each subset. Similar analyses of bone marrow B cells from the IB10 and ID4 transgenic mice showed almost identical results.
Figure 5
Figure 5
Similar proliferation of IA7 and BALB/c bone marrow B cell subsets. To determine the fraction of cycling bone marrow B cells, nine BALB/c and eight IA7 littermates were fed with BrdU for 2 d. Bone marrow cells were analyzed flow cytometrically by acquiring 3 × 10⁴ cells stained for B220 and IgM as described in the legend to Fig. 2, and after permeabilization with an FITC-labeled anti-BrdU antibody. In both groups of mice pre-B (IgM B220low), immature (IgM+ B220low) BALB/c, and mature (IgM+/low B220high) bone marrow B cells incorporated similar amounts of BrdU, indicating comparable proliferation rates. Similar results were obtained when we used ID4 instead of IA7 transgenic mice.
Figure 6
Figure 6
Expression of downstream genes depending on Egr-1 activity. (A) Upregulated BP-1 expression in transgenic mice. Bone marrow cells from a BALB/c control littermate and an IA7 mouse were analyzed flow cytometrically by acquiring 3 × 10⁴ live cells stained for B220, IgM, and BP-1. The dot plots are gated B220+ cells and illustrate increased levels and a higher percentage of BP-1 staining in both IgM and IgM+ subsets. IB10 and ID4 mice showed very similar changes in BP-1 expression. (B) Induction of nur77 in transgenic bone marrow B cells. Using ID4 and BALB/c mice with comparable percentages of mature bone marrow B cells, B220+ cells were purified from the bone marrow as described in the legend to Fig. 2. In the BALB/c sample, protein extracts from 3.3 × 10⁶ B220low and 1.3 × 10⁵ B220high cells (as determined by FACS® analysis) were loaded; for the ID4 sample, the respective amounts were 3 × 10⁶ B220low and 2 × 10⁵ B220high cells. Nur77 expression was detected by Western blotting using a nur77-specific antibody. The amount of protein loaded per lane was controlled by reprobing the blots with a goat anti–mouse IgM antibody. The staining shows elevated nur77 expression in ID4. Size markers (in kD) as indicated were run in parallel to the samples. (C) Binding of recombinant Egr-1 to sequences present in the BP-1 and nur77 promoters. Recombinant Egr-1 was incubated with radioactively labeled oligonucleotides carrying a cognate Egr-1 binding site (lanes 1–7, Egr-1), with an oligonucleotide from the nur77 promoter (lanes 8–14, nur77), or with an oligonucleotide from the BP-1 promoter (lanes 15–21, BP-1) and analyzed by EMSA as described previously (reference 45). The sequences of the respective Egr-1 binding sites are shown (top). Specific binding was proven first by competing either with an excess of an unlabeled oligonucleotide carrying a cognate Egr-1 binding site (lanes 4, 5; 11, 12; 18, 19) or by using an oligonucleotide with an Sp-1 site (lanes 2, 3; 9, 10; 16, 17), and second by inducing a “supershift” by adding the Egr-1–specific antibody C19 to the binding reaction (lanes 6, 13, and 20). Replacing the Egr-1–specific antibody with an Sp-1–specific antibody had no effect on the migration of the DNA–Egr-1 complex (lanes 7, 14, and 21).

References

    1. Sukhatme VP, Kartha S, Toback FG, Taub R, Hoover RG, Tsai-Morris CH. A novel early growth response gene rapidly induced by fibroblast, epithelial cell and lymphocyte mitogens. Oncogene Res. 1987;1:343–355. - PubMed
    1. Lemaire P, Revelant O, Bravo R, Charnay P. Two mouse genes encoding potential transcription factors with identical DNA-binding domains are activated by growth factors in cultured cells. Proc Natl Acad Sci USA. 1988;85:4691–4695. - PMC - PubMed
    1. Milbrandt J. A nerve growth factor-induced gene encodes a possible transcriptional regulatory factor. Science. 1987;238:797–799. - PubMed
    1. Kharbanda S, Nakamura T, Stone R, Hass R, Bernstein S, Datta R, Sukhatme VP, Kufe D. Expression of the early growth response 1 and 2 zinc finger genes during induction of monocytic differentiation. J Clin Invest. 1991;88:571–577. - PMC - PubMed
    1. Seyfert VL, Sukhatme VP, Monroe JG. Differential expression of a zinc finger-encoding gene in response to positive versus negative signaling through receptor immunoglobulin in murine B lymphocytes. Mol Cell Biol. 1989;9:2083–2088. - PMC - PubMed

Publication types

MeSH terms