. 1998 Dec 21;188(12):2289-99.
doi: 10.1084/jem.188.12.2289.

Genetic regulation of commitment to interleukin 4 production by a CD4(+) T cell-intrinsic mechanism

Affiliations

Genetic regulation of commitment to interleukin 4 production by a CD4(+) T cell-intrinsic mechanism

M Bix et al. J Exp Med. .

Abstract

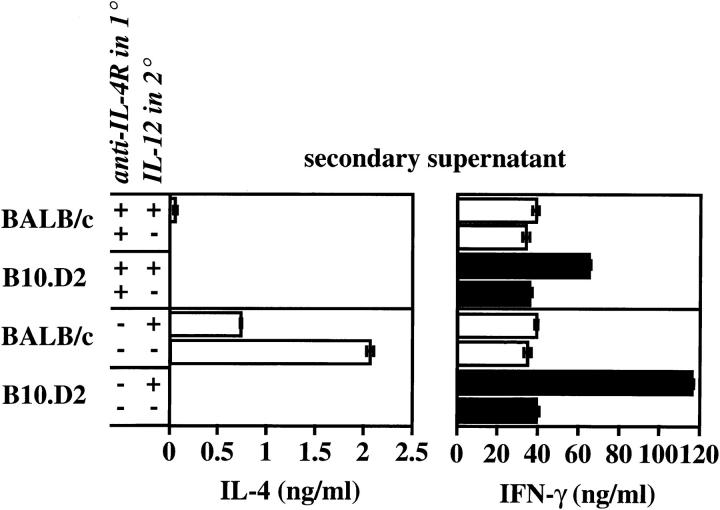
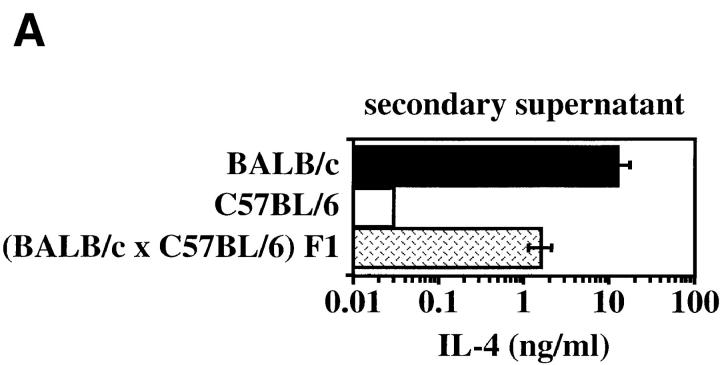
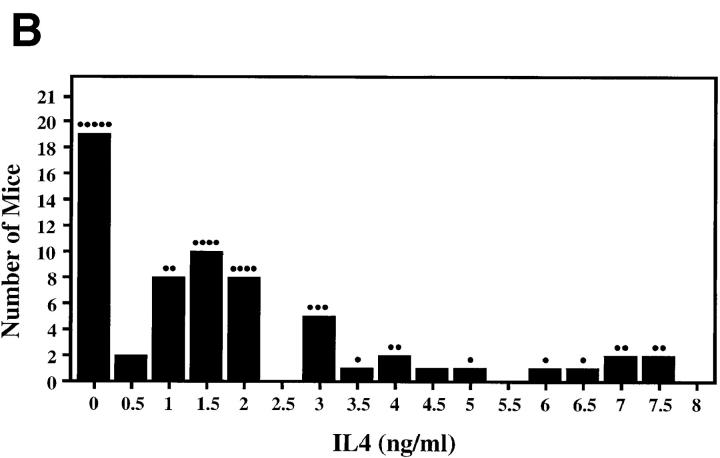
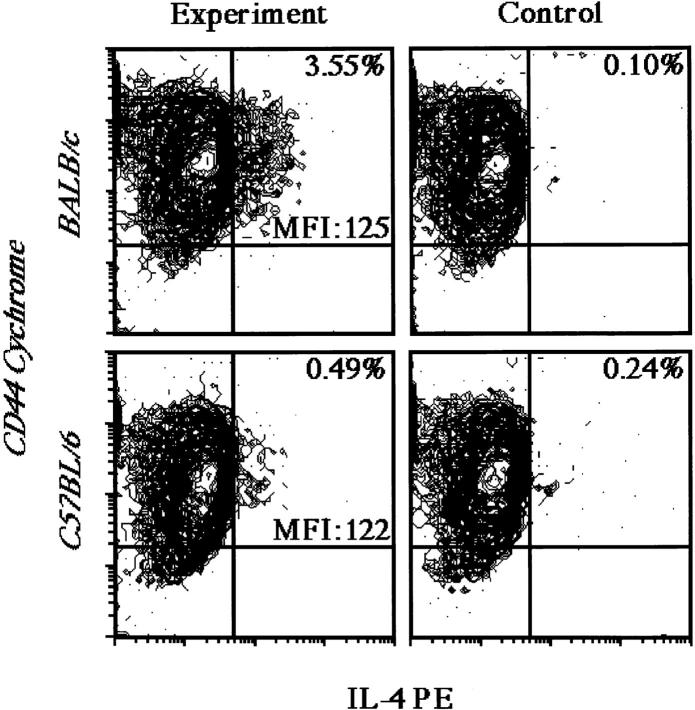
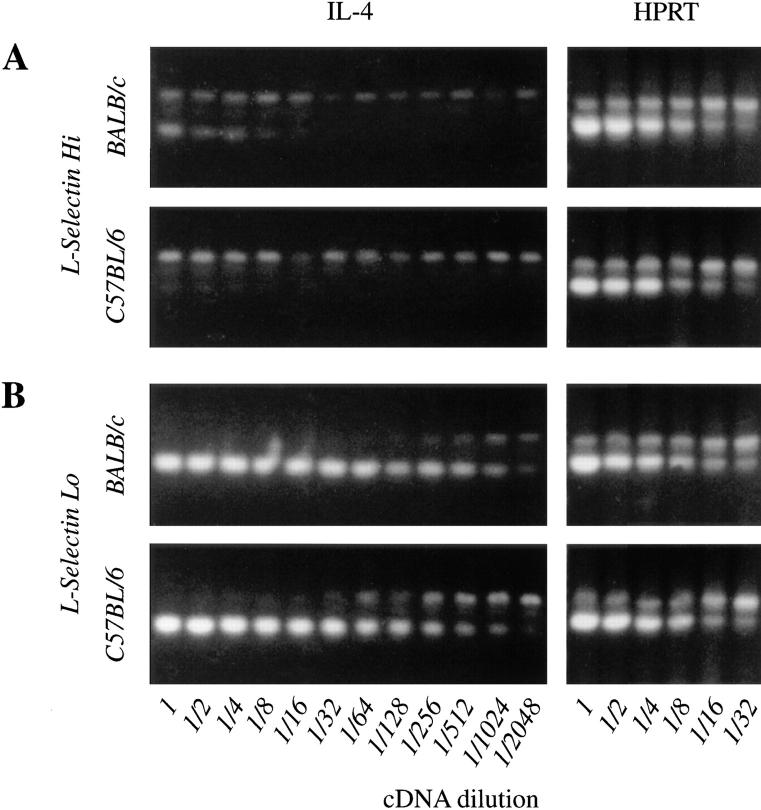
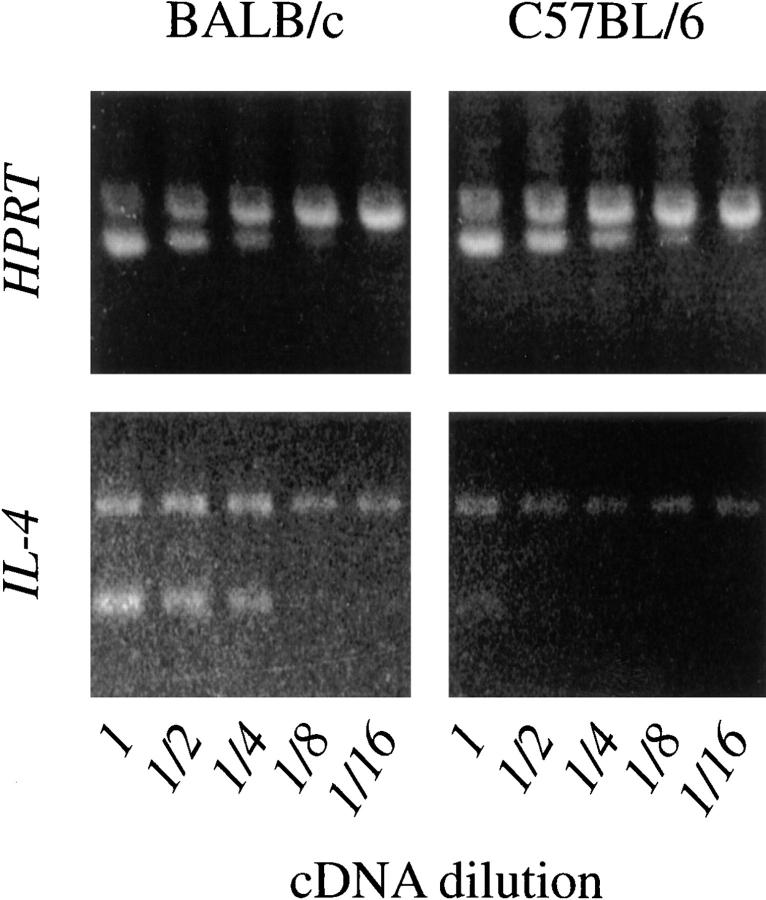
The dysregulated expression of interleukin 4 (IL-4) can have deleterious effects on the outcome of infectious and allergic diseases. Despite this, the mechanisms by which naive T cells commit to IL-4 expression during differentiation into mature effector cells remain incompletely defined. As compared to cells from most strains of mice, activated CD4(+) T cells from BALB mice show a bias towards IL-4 production and T helper 2 commitment in vitro and in vivo. Here, we show that this bias arises not from an increase in the amount of IL-4 produced per cell, but rather from an increase in the proportion of CD4(+) T cells that commit to IL-4 expression. This strain-specific difference in commitment was independent of signals mediated via the IL-4 receptor and hence occurred upstream of potential autoregulatory effects of IL-4. Segregation analysis of the phenotype in an experimental backcross cohort implicated a polymorphic locus on chromosome 16. Consistent with a role in differentiation, expression of the phenotype was CD4(+) T cell intrinsic and was evident as early as 16 h after the activation of naive T cells. Probabilistic gene activation is proposed as a T cell-intrinsic mechanism capable of modulating the proportion of naive T cells that commit to IL-4 production.


Figures

Figure 1
Figure 1
IL-4 production by CD4-enriched spleen cell populations. Spleen cells from BALB/c (H-2d), BALB.B (H-2b), BALB.K (H-2k), and B10.D2 (H-2d) mice were depleted of CD8+ T cells and were activated with anti-TCRβ and anti-CD28 mAbs in the presence of IL-2, and in the absence (left) or presence (right) of anti–IL-4 mAb. After 5 d, cells were restimulated with fresh APCs, anti-TCRβ mAb, and IL-2. After 48 h, the supernatants were harvested and analyzed for IL-4 by ELISA. Results depict means ± SEM of triplicate determinations. C57BL/6 cells gave results comparable to B10.D2 cells.
Figure 2
Figure 2
Defining the high IL-4 phenotype in BALB/c CD4+ T cells. (A) Highly purified L-selectinhi CD4+ T cells from 10th-backcross BALB/c or C57BL/6 IL-4–deficient mice were incubated with anti-TCRβ mAb, anti-CD28 mAb, IL-2, CTLA4-Ig, and BALB/c APCs. Murine recombinant IL-4 was added at the designated concentrations. After 5 d, cells were washed extensively, counted, and recultured in the presence of fresh anti-TCRβ mAb, IL-2, and APCs. After 2 d, the supernatants were collected and analyzed for IL-5 by ELISA. Results depict the mean ± SEM of triplicate determinations and are representative of three comparable experiments. (B) Highly purified L-selectinhi CD4+ T cells from BALB/c or B10.D2 mice were stimulated with anti-TCRβ mAb, anti-CD28 mAb, IL-2, CTLA4-Ig, and BALB/c APCs, but in the absence or presence of anti–IL-4R mAb as designated. After 5 d, primary supernatants were collected, and the cells were washed, counted, and recultured with anti-TCRβ mAb, IL-2, and APCs. After 2 d, the secondary supernatants were collected. Both primary and secondary supernatants were analyzed for IL-4 by ELISA. Results depict means ± SEM of triplicate determinations and are representative of three comparable experiments.
Figure 3
Figure 3
Loss of IL-12 responsiveness segregates independently from IL-4 production. Highly purified L-selectinhi CD4+ T cells from BALB/c and B10.D2 mice at 106 cells/ml were stimulated with anti-TCRβ and anti-CD28 mAbs and IL-2 in the presence of irradiated BALB/c APC and human CTLA4-Ig (20 μg/ml) to block intrinsic CD28/CTLA4 ligands, and in the presence or absence of 25 μg/ml anti–IL-4R mAb as designated. After 5 d, cells were washed extensively and recultured for 2 d at 106 cells/ml with fresh APCs, anti-TCRβ mAb, and IL-2, in the presence or absence of recombinant IL-12 (10 ng/ml). After 2 d, the supernatants were collected and analyzed for IL-4 and IFN-γ using ELISA. Results depict the means ± SEM of triplicate determinations and are representative of two comparable experiments.
Figure 4
Figure 4
Genotypic analysis of the high IL-4 phenotype. (A) CD4-enriched spleen cells from BALB/c, C57BL/6, and (BALB/c × C57BL/6) F1 mice were cultured with anti-TCR and anti-CD28 mAbs with IL-2. The supernatants were harvested 48 h after the second stimulation and were analyzed for IL-4 by ELISA. Results depict means ± SEM of triplicate determinations and are representative of five experiments. (B) Distribution of IL-4 production during secondary stimulation by CD4+ T cells from 63 progeny of C57BL/6 × (BALB/c × C57BL/6) F1 mice. Individual mice displaying similar IL-4 levels are grouped together in bins represented as vertical columns in increasing increments of 0.5 ng/ml IL-4 (e.g., mice in the column above 1 had IL-4 levels >0.5 and ≤1.0). Individual mice that inherited the BALB/c D16Mit81 allele are indicated as discrete dots (•) above each vertical column. (C) Interval mapping with markers along the centromeric region of chromosome 16. A cohort of 63 C57BL/6 × (BALB/c × C57BL/6) F1 progeny was typed for its IL-4 phenotype and for inheritance of parental polymorphic simple sequence length markers that spanned the mouse genome. The likelihood of inheriting a BALB/c allele at D16Mit81 correlated with the high IL-4 phenotype, with a peak lod score of 3.8 (P < 0.004). Locations of polymorphic markers are shown at the bottom, with black horizontal bar depicting 95% confidence interval.
Figure 4
Figure 4
Genotypic analysis of the high IL-4 phenotype. (A) CD4-enriched spleen cells from BALB/c, C57BL/6, and (BALB/c × C57BL/6) F1 mice were cultured with anti-TCR and anti-CD28 mAbs with IL-2. The supernatants were harvested 48 h after the second stimulation and were analyzed for IL-4 by ELISA. Results depict means ± SEM of triplicate determinations and are representative of five experiments. (B) Distribution of IL-4 production during secondary stimulation by CD4+ T cells from 63 progeny of C57BL/6 × (BALB/c × C57BL/6) F1 mice. Individual mice displaying similar IL-4 levels are grouped together in bins represented as vertical columns in increasing increments of 0.5 ng/ml IL-4 (e.g., mice in the column above 1 had IL-4 levels >0.5 and ≤1.0). Individual mice that inherited the BALB/c D16Mit81 allele are indicated as discrete dots (•) above each vertical column. (C) Interval mapping with markers along the centromeric region of chromosome 16. A cohort of 63 C57BL/6 × (BALB/c × C57BL/6) F1 progeny was typed for its IL-4 phenotype and for inheritance of parental polymorphic simple sequence length markers that spanned the mouse genome. The likelihood of inheriting a BALB/c allele at D16Mit81 correlated with the high IL-4 phenotype, with a peak lod score of 3.8 (P < 0.004). Locations of polymorphic markers are shown at the bottom, with black horizontal bar depicting 95% confidence interval.
Figure 5
Figure 5
Intracellular IL-4 expression in stimulated CD4+ T cells. CD4-enriched T cells from BALB/c and C57BL/6 mice were stimulated in the presence of anti–IL-4R mAb (M1, 25 μg/ml) and IL-2 in wells precoated with anti-TCRβ mAb and anti-CD28 mAb. After 13 h, 10 μg/ml brefeldin A was added to promote the accumulation of secreted proteins. After an additional 3 h of culture, the cells were stained for the activation marker CD44 and, after permeabilization, for intracellular IL-4 content. Controls were handled identically, except that anti–IL-4–PE mAb was incubated with recombinant murine IL-4 before use in the cell-staining assays. Viable CD44+ T cells were gated using forward and side-scatter characteristics for their intensity of IL-4 staining (left) as compared to staining in the presence of control reagents (right). Percentages reflect IL-4 positive cells. MFI, mean fluorescence intensity of the IL-4 gate. Results from one of four comparable experiments are shown.
Figure 6
Figure 6
Expression of the high IL-4 phenotype in highly purified L-selectinhi and L-selectinlo CD4+ T cells populations. Highly purified L-selectinhi (A) and L-selectinlo (B) CD4+ T cells were incubated in wells precoated with anti-TCRβ and anti-CD28 mAbs, IL-2, and anti–IL-4R mAb. After 16 h, mRNA was purified, reverse transcribed, and analyzed for the presence of IL-4 transcripts in relation to the expression of constitutively expressed HPRT transcripts using competitive PCR. Upper bands in each gel denote the amplified competitor product, lower bands denote the authentic transcript prepared from the cells indicated.
Figure 7
Figure 7
Expression of the high IL-4 phenotype in BALB/c-origin CD4+ T cells from F1 chimeric mice. T cells from irradiated, reconstituted, (BALB/c × C57BL/6) F1 chimeric mice that contained a mixture of parentally derived lymphoid cells were sorted for expression of CD4+ and either H-2Db (C57BL/6 origin; right) or H-2Dd (BALB/c origin; left), but not both (F1 origin). Purified cells were incubated in wells precoated with anti-TCRβ and anti-CD28 mAbs, IL-2, and anti–IL-4R mAb. After 16 h, the RNA was purified and analyzed for IL-4 expression using the competitive PCR assay.

References

    1. Abbas AK, Murphy KM, Sher A. Functional diversity of helper T lymphocytes. Nature. 1996;383:787–793. - PubMed
    1. Seder RA, Paul WE, Davis MM, Fazekas de St B, Groth The presence of IL-4 during in vivo priming determines the lymphokine-producing potential of CD4+T cells from T cell receptor transgenic mice. J Exp Med. 1992;176:1091–1098. - PMC - PubMed
    1. Hsieh C-S, Heimberger AB, Gold JS, O'Garra A, Murphy KM. Differential regulation of T helper phenotype development by interleukins 4 and 10 in an αβ-T cell receptor transgenic system. Proc Natl Acad Sci USA. 1992;89:6065–6069. - PMC - PubMed
    1. Hsieh C-S, Macatonia SE, O'Garra A, Murphy KM. T cell genetic background determines default T helper phenotype development in vitro. J Exp Med. 1995;181:713–721. - PMC - PubMed
    1. Guery J-C, Galbiati F, Smiroldo S, Adorini L. Selective development of T helper (Th) 2 cells induced by continuous administration of low dose soluble proteins to normal and β2-microglobulin–deficient BALB/c mice. J Exp Med. 1996;183:485–496. - PMC - PubMed

Publication types

MeSH terms