. 1999 Jan;19(1):121-35.
doi: 10.1128/MCB.19.1.121.

Spi-1/PU.1 is a positive regulator of the Fli-1 gene involved in inhibition of erythroid differentiation in friend erythroleukemic cell lines

Affiliations

Spi-1/PU.1 is a positive regulator of the Fli-1 gene involved in inhibition of erythroid differentiation in friend erythroleukemic cell lines

J Starck et al. Mol Cell Biol. 1999 Jan.

Abstract

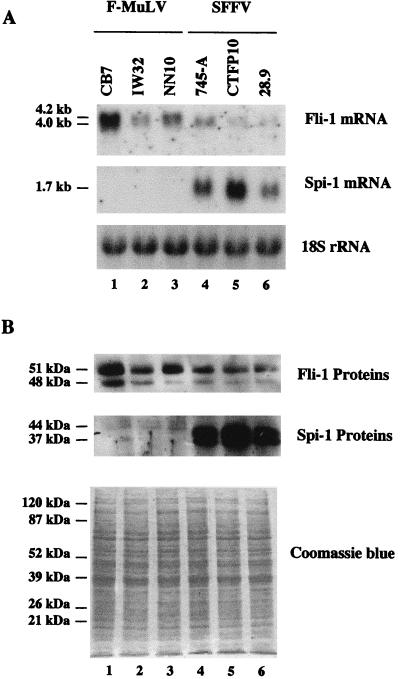
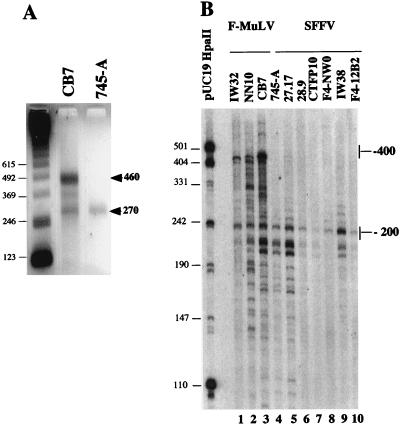
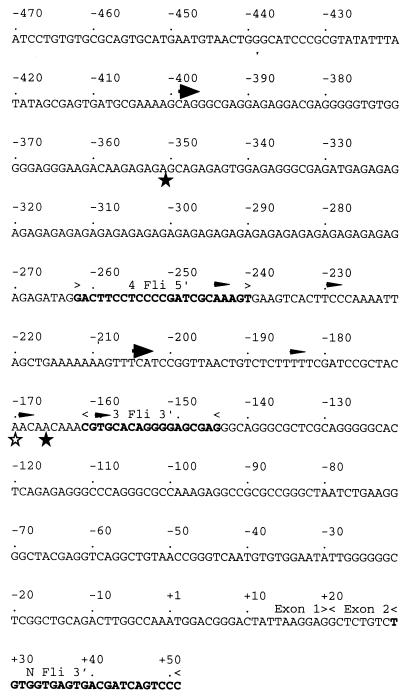
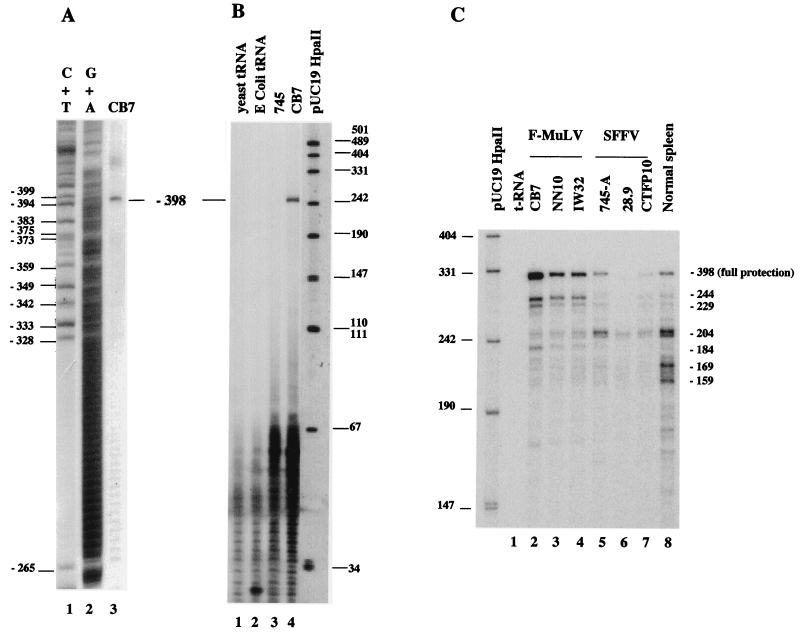
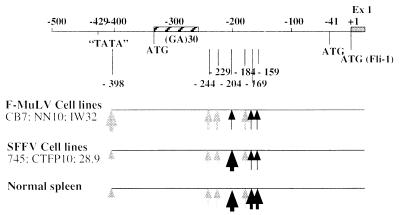
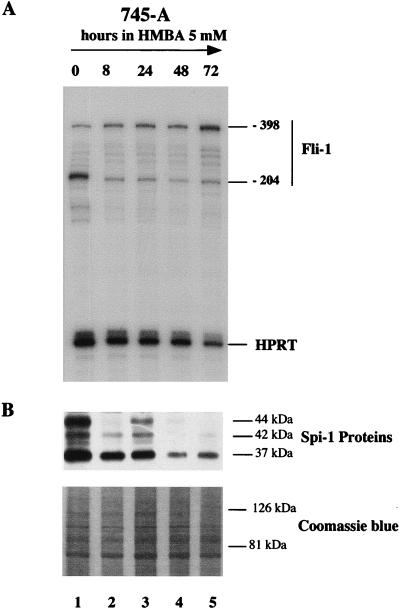
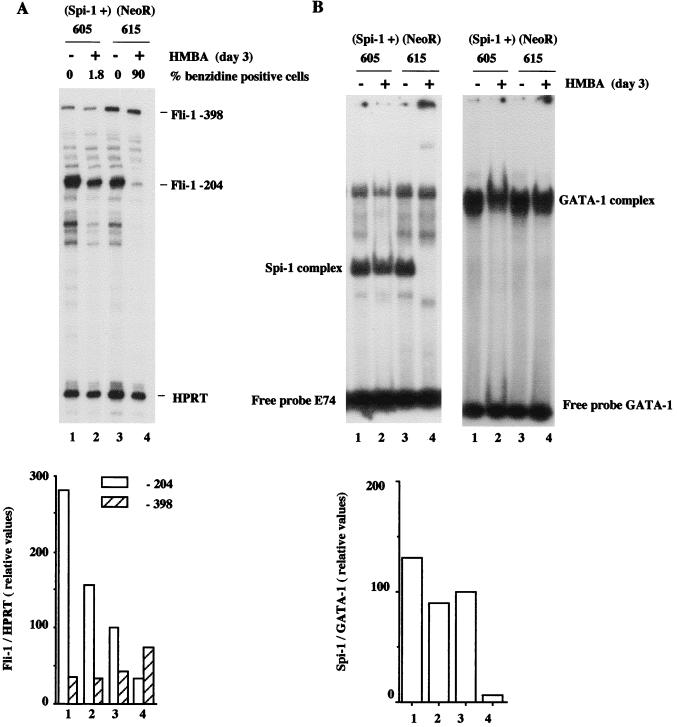
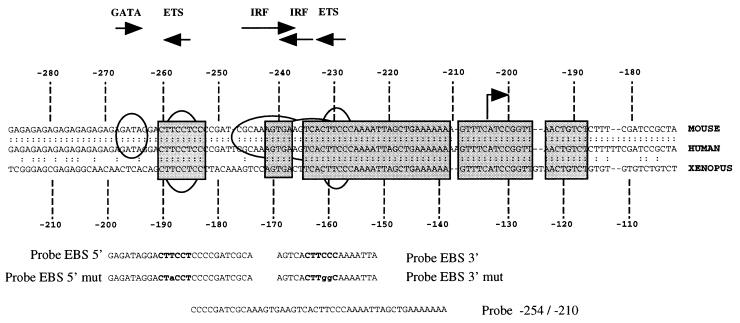
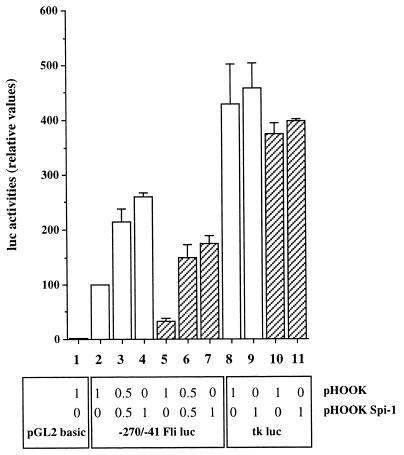
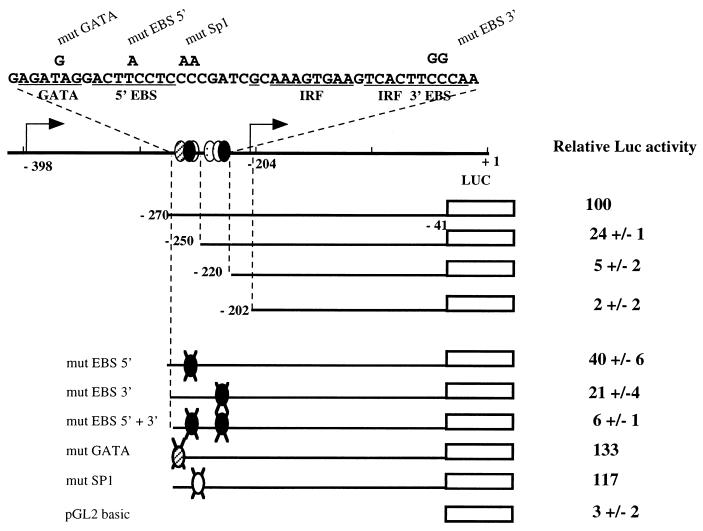
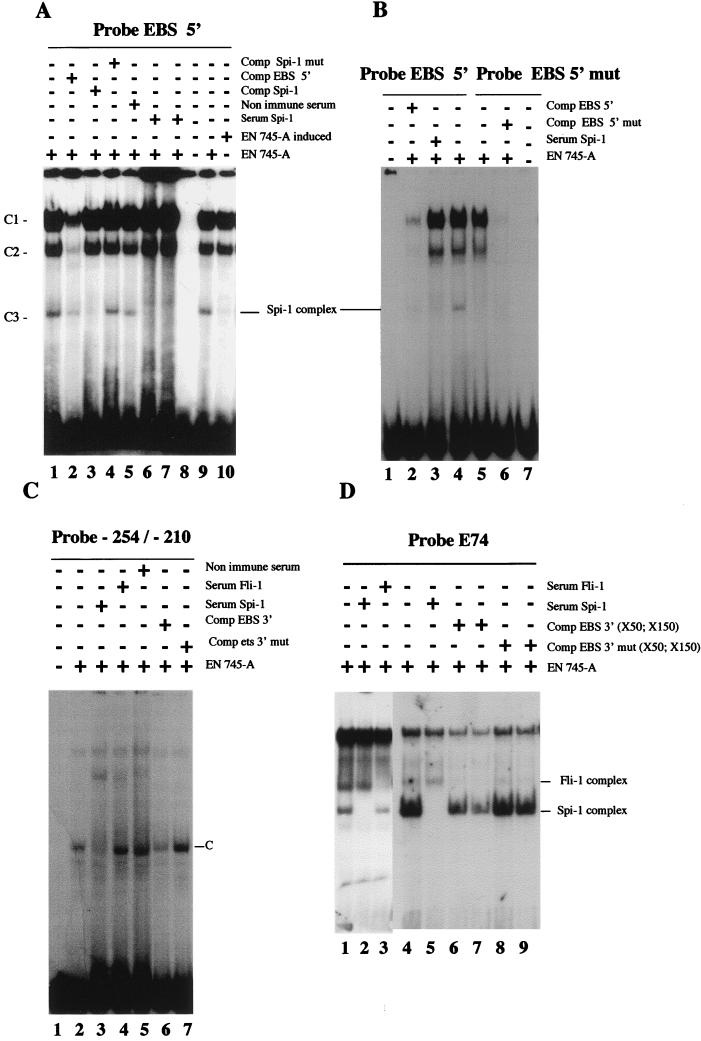
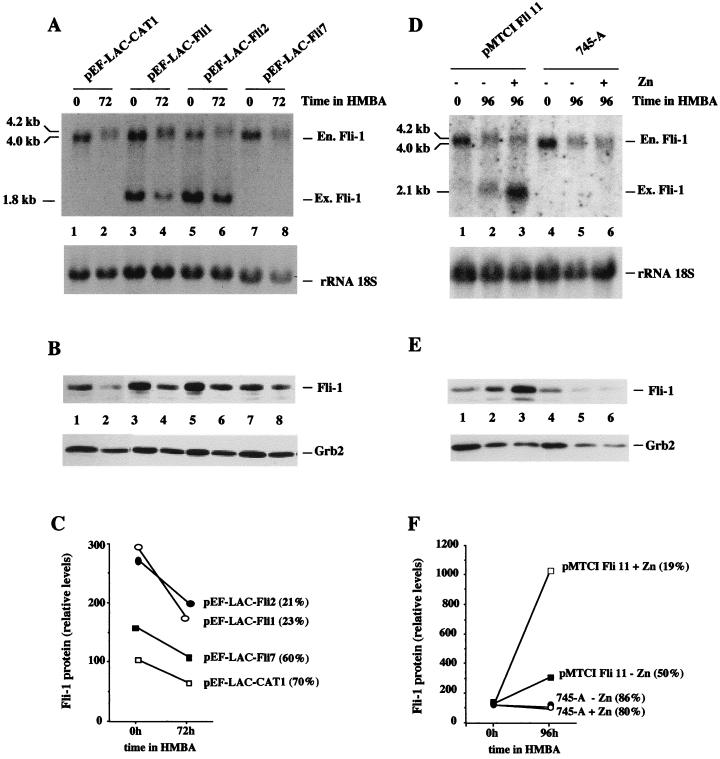
Spi-1/PU.1 and Fli-1 are two members of the ETS family of transcription factors whose expression is deregulated by proviral insertion in most erythroleukemic cell lines induced by the spleen focus-forming virus (SFFV) and Friend murine leukemia virus (F-MuLV) components of the Friend viral complex, respectively. In this study, we present evidence that transcription of the Fli-1 gene is positively regulated by Spi-1/PU.1 in SFFV-transformed cell lines: (i) all SFFV-transformed cell lines expressing Spi-1/PU.1 are characterized by a specific pattern of Fli-1 gene transcripts initiated in the -200 region instead of position -400 as reported for F-MuLV-transformed cell lines; (ii) these Fli-1 transcripts initiated in the -200 region are downregulated in parallel with that of Spi-1/PU.1 during hexamethylenebisacetamide (HMBA) induced differentiation; and (iii) Fli-1 transcription is upregulated in SFFV cells lines following stable transfection of a Spi-1/PU.1 expression vector. Furthermore, we found by transient transfection assays that the -270/-41 region of the Fli-1 gene displays promoter activity which is transactivated by Spi-1/PU.1. This promoter is strictly dependent on the integrity of two highly conserved ETS DNA binding sites that bind the Spi-1/PU.1 protein in vitro. Finally, we show that transfection of constitutive or inducible Fli-1 expression vectors in SFFV-transformed cells inhibits their erythroid differentiation induced by HMBA. Overall, these data indicate that Fli-1 is a target gene of the Spi-1/PU.1 transcription factor in SFFV-transformed cell lines. We further suggest that deregulated synthesis of Fli-1 may trigger a common mechanism contributing to erythroleukemia induced by either SFFV or F-MuLV.


Figures

FIG. 1
FIG. 1
Fli-1 and Spi-1 gene expression in erythroleukemic cell lines established from mice infected by F-MuLV or SFFV. (A) Total RNA (10 μg) prepared from the indicated cell lines was subjected to electrophoresis, transferred to a membrane, and successively hybridized with the Fli-1 (top), Spi-1/PU.1 (middle), and 18S rRNA (bottom) radiolabeled probes. (B) Western blot analysis was performed with 20 μg of total cell proteins of the indicated cell lines by using anti-Fli-1 (top) or anti-Spi-1 (middle) antibodies. Photograph of a duplicate of the gel stained by Coomassie blue is shown (bottom) as a control for equal loading of all cell protein samples.
FIG. 2
FIG. 2
Analysis of the Fli-1 transcription initiation site(s) by 5′ RACE (A) and primer extension (B) techniques, using primer NFli3′. (A) Electrophoretic analysis of 5′ RACE reaction products (see Materials and Methods) obtained by using poly(A)+ mRNA prepared from CB7 or 745-A cells. Arrowheads indicate the main reaction products. Sizes of molecular weight markers are shown in base pairs on the left. (B) Electrophoretic analysis of extension products obtained from total RNA prepared from the indicated cell lines. The relative (to the ATG codon) positions of main extension products in F-MuLV- and SFFV-transformed lines are shown on the right. Sizes of molecular weight markers (pUC19/HpaII) are shown in base pairs on the left.
FIG. 3
FIG. 3
DNA sequence of the 5′ region of the mouse Fli-1 gene (1). Coordinates are shown relative to ATG initiation codon of the 51-kDa Fli-1 protein. The primers used to characterize the 5′ ends of Fli-1 transcripts are shown in boldface. The 5′ ends of major 5′ RACE products are indicated by unfilled and filled stars for the 745-A and CB7 cell lines, respectively. Major and minor transcription initiation sites further characterized by S1 and RNase mapping are indicated by large and thin arrowheads, respectively.
FIG. 4
FIG. 4
Analysis of Fli-1 transcription initiation sites by S1 nuclease protection assay (A) or RNase mapping (B and C) in transformed and normal murine cells. (A) Electrophoretic analysis of S1-protected fragments obtained from total RNA of F-MuLV-transformed CB7 cells and 5′-end-labeled DNA probe 1 (−1298/−156) (lane 3). The Maxam-Gilbert C+T and G+A ladders of the same probe are shown in lanes 1 and 2, respectively. Positions of C and T nucleotides in the mouse Fli-1 sequence (Fig. 3) are shown on the left. (B) Electrophoretic analysis of RNase-protected fragments detected with antisense RNA probe 2 (−1298/−144) and total RNA prepared from SFFV-transformed 745-A cells (lane 3) and F-MuLV-induced CB7 cells (lane 4). (C) Electrophoretic analysis of RNase-protected fragments detected with antisense RNA probe 3 (−262/+52) and total RNA prepared from the F-MuLV (lanes 2 to 4)- or SFFV (lanes 5-7)-transformed cells and normal mouse spleen (lane 8). The coordinates of major protected fragments on the Fli-1 sequence are shown on the right.
FIG. 5
FIG. 5
Map of Fli-1 transcription initiation sites determined by 5′ RACE, S1 nuclease protection, or RNase protection assays in F-MuLV-transformed, SFFV-transformed lines, or normal mouse spleen cells. The 5′ region of the Fli-1 gene is schematically shown at the top. The relative abundance of the transcripts initiated at these different sites in tested cells is illustrated by the thickness of the vertical arrows. Ex1, exon 1 coding sequence.
FIG. 6
FIG. 6
Kinetic analysis of Fli-1 transcript and Spi-1/PU.1 protein levels in HMBA-treated 745-A cells. (A) RNase protection assay using a mixture of the antisense Fli-1 RNA probe 3 (−262/+52) and the antisense RNA probe HPRT. The protected fragments corresponding to the major Fli-1 transcripts initiated at positions −204 and −398 as well as the HPRT transcript are indicated on the right. (B) Western blot analysis of Spi-1/PU.1 proteins. The positions of major protein bands (determined by comparison with molecular weight standards [not shown]) are indicated on the right. The time of HMBA (5 mM) treatment is indicated at the top. A photograph of the upper part of the gel stained by Coomassie blue is shown (bottom) as a control for equal loading of protein samples.
FIG. 7
FIG. 7
Quantitative analysis of −204 and −398 Fli-1 transcripts and Spi-1/PU.1 DNA binding activity in Spi-1/PU.1-overexpressing DS19/605 (lanes 1 and 2) and control DS19/615 (lanes 3 and 4) cells treated (lanes 2 and 4) or not treated (lanes 1 and 3) for 3 days with 5 mM HMBA. (A) Top, autoradiogram of gel with protected Fli-1 and HPRT fragments (internal control) detected by RNase protection assay using antisense Fli-1 RNA probe 3 (−262/+52) and antisense HPRT probe. Fli-1 and HPRT transcripts corresponding to detected protected fragments are indicated on the right. Bottom, quantitation of −204 and −398 Fli-1 transcripts. The signals corresponding to −204, −398 Fli-1, and HPRT transcripts were quantified by phosphorimager analysis. The relative abundance of −204 Fli-1 transcripts (to HPRT transcripts) in untreated control DS19/615 cells was arbitrarily chosen as 100. (B) Top left, EMSA of Spi-1/PU.1 DNA binding activity, using labeled E74 probe and equal amounts of protein nuclear extracts prepared from the indicated cells. The position of Spi-1/PU.1 complex, identified by Spi-1/PU.1 antiserum (Fig. 11D), is indicated on the right. Top right, EMSA of GATA-1 DNA binding activity, using labeled GATA-1 probe and equal amounts of protein nuclear extracts prepared from the indicated cells. The position of the GATA-1 complex is indicated on the right. Bottom, the signals corresponding to Spi-1/PU.1 and GATA-1 complexes were quantified by phosphorimager analysis. The relative abundances of Spi-1/PU.1 complexes, standardized to the corresponding abundances of GATA-1 complexes, are reported as percentages of the Spi-1/GATA-1 ratio determined for untreated control DS19/615 cells, taken as 100%.
FIG. 8
FIG. 8
Phylogenetic conservation of the −200 region of the Fli-1 gene shown by the alignment of 5′ sequences of the mouse (1), human (1), and Xenopus Fli-1 (30) genes. The region spanning bp −280 to −180 of mouse and human Fli-1 genes, corresponding to bp −210 to −110 bp of the Xenopus homologous gene, is shown. Conserved sequences are boxed. Consensus DNA binding sites for GATA, ETS, or IRF family transcription factors are indicated above sequences by horizontal arrows. The position of the major transcription initiation −204 site found in SFFV-transformed cells is shown by a vertical arrow. Oligonucleotides (probes) used in EMSA (see text) are shown below the sequences.
FIG. 9
FIG. 9
Spi-1/PU.1-regulated promoter activity of the −270/−41 region of the mouse Fli-1 gene in 745-A cells. 745-A cells (106) were transfected with equal amounts (2 μg) of either pGL2-basic, tk-luc, or −270/−41 Fli-1 luc reporter construct together with the indicated amount of either Spi-1 expression vector pHOOK-Spi-1 or empty vector pHOOK in the presence (hatched boxes) or absence (empty boxes) of 5 mM HMBA as indicated. Luciferase activities were determined on lysates prepared from equal numbers of cells from each lot of transfected cells 24 h following the addition of DNA. The experiment was repeated three times, and the results are given as means of relative luciferase activities standardized for each repetition by the activity (taken as 100%) obtained for cells transfected with the −270/−41 Fli-1 luc construct in the absence of both pHOOK-Spi-1 and HMBA (lane 2).
FIG. 10
FIG. 10
Identification of sequences contributing to promoter activity of the −270/−41 mouse Fli-1 region. Reporter constructs containing the deleted (top) or mutated (in indicated sites; bottom) version of the −270/−41 Fli-1 region were transfected into 745-A cells. The luciferase (Luc) signals were measured and normalized by β-galactosidase activities of a cotransfected CMV-gal construct. The normalized signal of the parental −270/−41 reporter construct was arbitrarily chosen as 100. Representative data from three different experiments are shown.
FIG. 11
FIG. 11
In vitro binding of Spi-1/PU.1 to EBSs of the −270/−41 Fli-1 region. Radiolabeled oligonucleotides spanning the 5′ EBS (A and B) or 3′ EBS (C) of the −270/−41 Fli-1 region (Fig. 8), or radiolabeled oligonucleotide E74 containing a consensus EBS (D), were tested in EMSA using nuclear extracts prepared from 745-A cells treated or not with 5 mM HMBA as indicated. The presence (+) and/or absence (−) of the indicated specific or nonimmune serum or excess of unlabeled oligonucleotides (competitors) is indicated. Major observed complexes C1 to C3 (in panel A) or C (in panel C) are indicated by arrows. The identified Spi-1/PU.1 and Fli-1 complexes are marked. In panel D, two different preparations of 745-A cell extracts were used in EMSAs shown in lanes 1 to 3 and 4 to 9. Free probe is not visible in panel D. The sequences of the different oligonucleotides used either as probes or as competitors are given in Fig. 8 and in Materials and Methods.
FIG. 12
FIG. 12
Deregulated overexpression of Fli-1 in 745-A cells inhibits their HMBA-induced erythroid differentiation. 745-A cells were stably transfected with empty vector pEF-LAC-CAT, Fli-1 constitutive expression vector pEF-LAC-Fli (A to C), or Fli-1 Zn-inducible Fli-1 expression vector pMTCI Fli (D to F), as indicated above the lanes, and individual clones were selected and amplified under appropriate antibiotic selection (G418 [1 mg/ml] for pEF-LAC-CAT or pEF-LAC-Fli and hygromycin [1 mg/ml] for pMTCI Fli). Individual clones or untransfected cells were grown for 3 (A to C) or 4 (D to F) days in the presence or absence of 5 mM HMBA with or without 200 μM ZnCl2 as indicated. The percentage of benzidine-positive differentiated cells was then determined, and total RNA and total protein cell lysates were prepared for Fli-1 RNA and protein analyses, respectively. (A and D) Northern blot sequentially hybridized with the Fli-1 probe (top) and the 18S rRNA probe (bottom). The positions of endogenous (En.) and exogenous (Ex.) Fli-1 transcripts are indicated on the right. (B and E) Results of Western blot analysis of Fli-1 proteins (top) and Grb2 proteins revealed on the same blot and taken as an internal standard (bottom). (C and F) Results of quantitative analyses of Fli-1 protein levels performed by densitometric tracing of the autoradiographs shown in panels B and E, respectively. Results are expressed as percentages of the Fli-1/Grb2 ratio determined for pEF-LAC-CAT1-transfected (C) and untransfected (F) 745-A cells, respectively. Numbers in parentheses indicate percentages of benzidine-positive cells.

References

    1. Barbeau B, Bergeron D, Beaulieu M, Nadjem Z, Rassart E. Characterization of the human and mouse Fli-1 promoter regions. Biochem Biophys Acta. 1996;1307:220–232. - PubMed
    1. Bègue A, Crépieux P, Vu-Dac N, Hauteville A, Spruyt N, Laudet V, Stehelin D. Identification of a second promoter in the human c-ets-2 proto-oncogene. Gene Expr. 1997;6:333–347. - PMC - PubMed
    1. Ben-David Y, Giddens E B, Bernstein A. Identification and mapping of a common proviral integration site Fli-1 in erythroleukemia cells induced by Friend murine leukemia virus. Proc Natl Acad Sci USA. 1990;87:1332–1336. - PMC - PubMed
    1. Ben-David Y, Giddens E R, Letwin K, Bernstein A. Erythroleukemia induction by Friend murine leukemia virus: insertional activation of a new member of the ets family, Fli-1, closely linked to c-ets-1. Genes Dev. 1991;5:908–919. - PubMed
    1. Ben-David Y, Bernstein A. Friend virus induced erythroleukemia and the multi stage of cancer. Cell. 1991;66:831–834. - PubMed

Publication types

MeSH terms

LinkOut - more resources