

Structural code for DNA recognition revealed in crystal structures of papillomavirus E2-DNA targets
- PMID: 9860945
- PMCID: PMC28019
- DOI: 10.1073/pnas.95.26.15194
Structural code for DNA recognition revealed in crystal structures of papillomavirus E2-DNA targets
Abstract
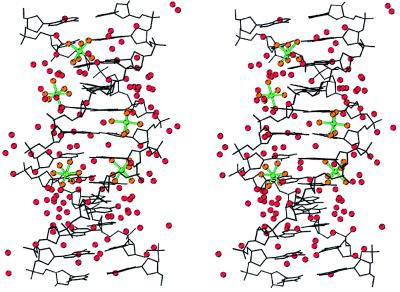
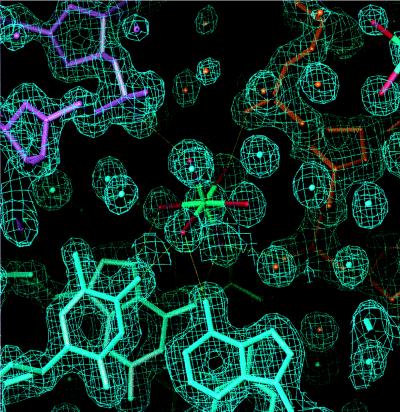
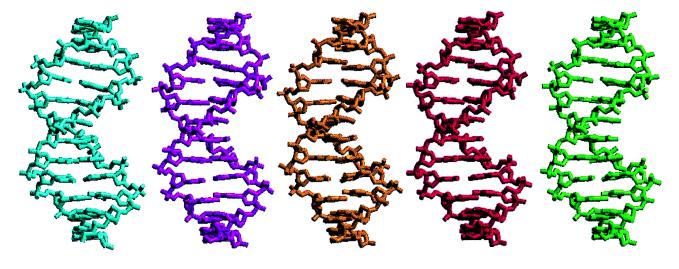
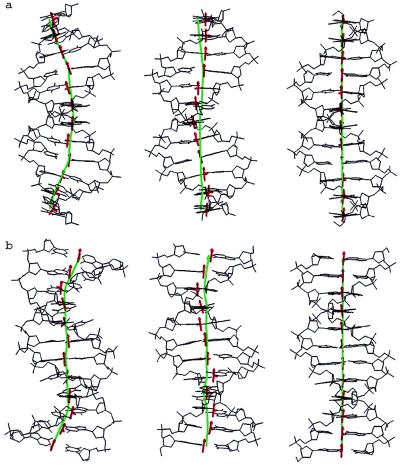
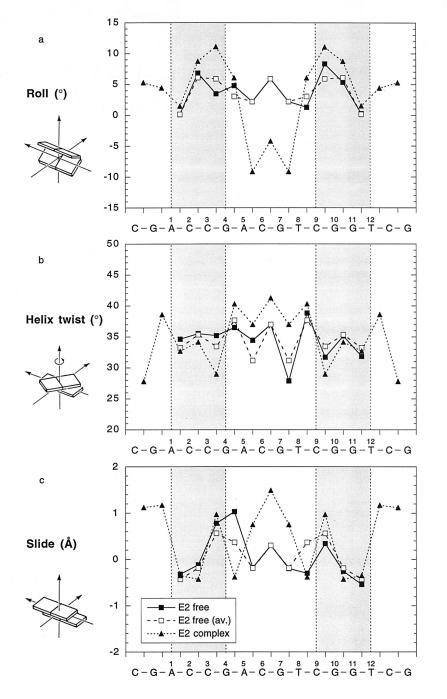
Transcriptional regulation in papillomaviruses depends on sequence-specific binding of the regulatory protein E2 to several sites in the viral genome. Crystal structures of bovine papillomavirus E2 DNA targets reveal a conformational variant of B-DNA characterized by a roll-induced writhe and helical repeat of 10.5 bp per turn. A comparison between the free and the protein-bound DNA demonstrates that the intrinsic structure of the DNA regions contacted directly by the protein and the deformability of the DNA region that is not contacted by the protein are critical for sequence-specific protein/DNA recognition and hence for gene-regulatory signals in the viral system. We show that the selection of dinucleotide or longer segments with appropriate conformational characteristics, when positioned at correct intervals along the DNA helix, can constitute a structural code for DNA recognition by regulatory proteins. This structural code facilitates the formation of a complementary protein-DNA interface that can be further specified by hydrogen bonds and nonpolar interactions between the protein amino acids and the DNA bases.
Figures
Comment in
-
DNA curvature and deformation in protein-DNA complexes: a step in the right direction.Proc Natl Acad Sci U S A. 1998 Dec 22;95(26):15163-5. doi: 10.1073/pnas.95.26.15163. Proc Natl Acad Sci U S A. 1998. PMID: 9860938 Free PMC article. Review. No abstract available.
References
-
- Li R, Knight J, Bream G, Stenlund A, Botchan M. Genes Dev. 1989;3:510–526. - PubMed
-
- Hegde R S, Grossman S R, Laimins L A, Sigler P B. Nature (London) 1992;359:505–512. - PubMed
-
- Hegde R S, Wang A-F, Kim S-S, Schapira M. J Mol Biol. 1998;276:797–808. - PubMed
-
- Otwinowski Z, Minor W. In: Macromolecular Crystallography, Part A. Carter C W Jr, Sweet R M, editors. Vol. 276. New York: Academic; 1997. pp. 307–326.
-
- Kabsch W. J Appl Crystallogr. 1988;21:916–924.
Publication types
MeSH terms
Substances
Grants and funding
LinkOut - more resources
Full Text Sources
