. 1998 Dec 22;95(26):15309-14.
doi: 10.1073/pnas.95.26.15309.

Conformational changes between the active-site and regulatory light chain of myosin as determined by luminescence resonance energy transfer: the effect of nucleotides and actin

Affiliations

Conformational changes between the active-site and regulatory light chain of myosin as determined by luminescence resonance energy transfer: the effect of nucleotides and actin

M Xiao et al. Proc Natl Acad Sci U S A. .

Abstract

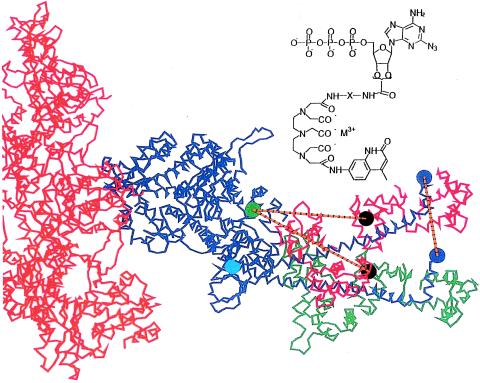
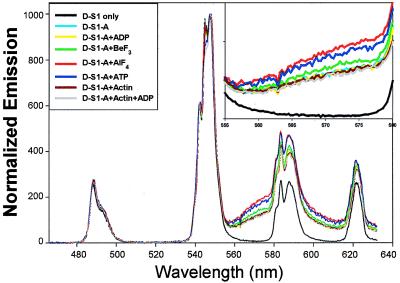
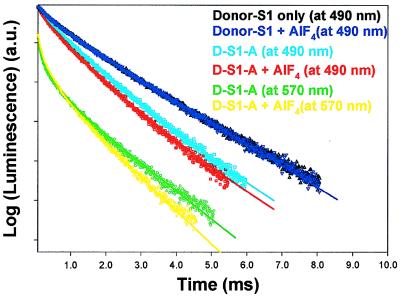
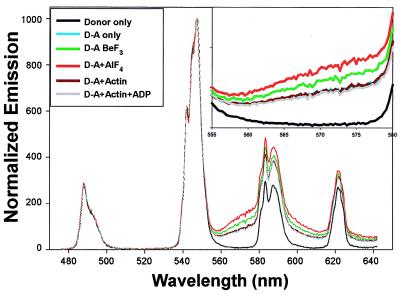
Myosin is thought to generate movement of actin filaments via a conformational change between its light-chain domain and its catalytic domain that is driven by the binding of nucleotides and actin. To monitor this change, we have measured distances between a gizzard regulatory light chain (Cys 108) and the active site (near or at Trp 130) of skeletal myosin subfragment 1 (S1) by using luminescence resonance energy transfer and a photoaffinity ATP-lanthanide analog. The technique allows relatively long distances to be measured, and the label enables site-specific attachment at the active-site with only modest affect on myosin's enzymology. The distance between these sites is 66.8 +/- 2.3 A when the nucleotide is ADP and is unchanged on binding to actin. The distance decreases slightly with ADP-BeF3, (-1.6 +/- 0.3 A) and more significantly with ADP-AlF4 (-4.6 +/- 0.2 A). During steady-state hydrolysis of ATP, the distance is temperature-dependent, becoming shorter as temperature increases and the complex with ADP.Pi is favored over that with ATP. We conclude that the distance between the active site and the light chain varies as Acto-S1-ADP approximately S1-ADP > S1-ADP-BeF3 > S1-ADP-AlF4 approximately S1-ADP-Pi and that S1-ATP > S1-ADP-Pi. The changes in distance are consistent with a substantial rotation of the light-chain binding domain of skeletal S1 between the prepowerstroke state, simulated by S1-ADP-AlF4, and the post-powerstroke state, simulated by acto-S1-ADP.


Figures

Figure 1
Figure 1
Structure of acto-S1, with the S1 heavy chain in blue, showing the LC domain in two positions, rotated about Gly770, the lower one representing the rigor complex (24) and the upper simulating the detected changes in distance between donor and acceptor assuming a rotation in the plane that contains the axis of the actin filament. The light chains attached to the rigor, putative-post-powerstroke are shown in green, and those of the simulated pre-powerstroke are shown in red; actin is shown in orange. Several sites are shown: Trp130 (cyan circle), the residue to which the terbium-donor is likely attached, and Cys108 (black circle), where the TMR acceptor is attached. The vertical orange line shows the resulting 35-Å displacement of residue 843 (red circle), corresponding to an ≈35-Å translation of the actin filament. Inset shows the structure of azido-ATP-Terbium-chelate used as donor. Two different linker lengths (“X”) in the donor were synthesized: M = Tb3+, X = L2 = (CH2)2 or L11 = (CH2)2NHCO(CH2)3CONH(CH2)2.
Figure 2
Figure 2
Spectral shape and energy transfer vs. bound ligands at 20°C using short-linker donor. The emission data were acquired beginning 150 μsec after the excitation pulse, thereby eliminating all prompt fluorescence. The curves are normalized at 545 nm. Inset is the enlarged view from 555 to 580 nm to emphasize the sensitized emission. The differences in sensitized emission indicate different amounts of energy transfer. Total integration time was 5–10 seconds (200–400 excitation pulses) with 0.35-nm resolution.
Figure 3
Figure 3
Donor lifetime and sensitized emission lifetime of the D-S1 and D-S1-A samples with and without AlF4. AlF4 does not effect D-S1 lifetime (control) but decreases donor and sensitized emission lifetimes in the donor–acceptor complex because of increased energy transfer. The D-S1 lifetime (490 nm) is 1.85 ms (76%) + 0.45 ms (24%) (black, without AlF4; dark blue, with AlF4). The donor-emission in the D-S1-A sample at 490 nm is 1.17 msec (66%) + 0.47 msec (17%) + 1.85 msec (17%) (light blue, without AlF4) and is 0.98 msec (62%) + 0.31 msec (21%) + 1.85 msec (17%) (red, with AlF4). The sensitized emission at 570 nm is 0.37 msec (54%) + 1.35 msec (46%) (green, without AlF4) and is 0.38 msec (55%) + 1.14 msec (45%) with AlF4. The data are the sum of 800 pulses for the donor lifetime and 3,200 pulses for sensitized emission lifetime.
Figure 4
Figure 4
Spectral data using the long linker donor. See Fig. 2 legend for details.

References

    1. Goldman Y E. Cell. 1998;93:1–4. - PubMed
    1. Cooke R. Physiol Rev. 1997;77:671–697. - PubMed
    1. Rayment I. J Biol Chem. 1996;271:15850–15853. - PubMed
    1. Dominguez R, Freyzon Y, Trybus K M, Cohen C. Cell. 1998;94:559–571. - PubMed
    1. Selvin P R, Hearst J E. Proc Natl Acad Sci USA. 1994;91:10024–10028. - PMC - PubMed

Publication types

MeSH terms