. 1998 Dec 22;95(26):15553-8.
doi: 10.1073/pnas.95.26.15553.

CpG DNA can induce strong Th1 humoral and cell-mediated immune responses against hepatitis B surface antigen in young mice

Affiliations

CpG DNA can induce strong Th1 humoral and cell-mediated immune responses against hepatitis B surface antigen in young mice

C L Brazolot Millan et al. Proc Natl Acad Sci U S A. .

Abstract

Successful neonatal immunization of humans has proven difficult. We have evaluated CpG-containing oligonucleotides as an adjuvant for immunization of young mice (1-14 days old) against hepatitis B virus surface antigen. The protein-alum-CpG formulation, like the DNA vaccine, produced seroconversion of the majority of mice immunized at 3 or 7 days of age, compared with 0-10% with the protein-alum or protein-CpG formulations. All animals, from neonates to adults, immunized with the protein-alum vaccine exhibited strong T helper (Th)2-like responses [predominantly IgG1, weak or absent cytotoxic T lymphocytes (CTL)]. Th2-type responses also were induced in young mice with protein-CpG (in 1-, 3-, and 7-day-old mice) and protein-alum-CpG (in 1- and 3-day-old mice) but immunization carried out at older ages gave mixed Th1/Th2 (Th0) responses. DNA vaccines gave Th0-like responses when administered at 1 and 7 days of age and Th1-like (predominantly IgG2a and CTL) responses with 14-day-old or adult mice. Surprisingly, the protein-alum-CpG formulation was better than the DNA vaccine for percentage of seroconversion, speed of appearance, and peak titer of the antibody response, as well as prevalence and strength of CTL. These findings may have important implications for immunization of human infants.


Figures

Figure 1
Figure 1
Percentage of seroconversion for BALB/c mice immunized in early life using either HBsAg with adjuvant(s) or an HBsAg-expressing DNA vaccine. HBsAg (1 μg) was combined with either 25 μg Al3+ (open bars), 10 μg CpG ODN (striped bars), or both alum and CpG ODN (shaded bars). The DNA vaccine (10 μg) encoded HBsAg under the control of a cytomegalovirus promoter (pCMV-S) (solid bars). Mice were immunized at <1, 3, 7, or 14 days after birth, and plasma taken at 12 weeks postimmunization was assayed for anti-HBs by endpoint-dilution ELISA assay. The fraction of mice exhibiting an anti-HBs endpoint-dilution titer >100 for any treatment is listed above the bar for that treatment.
Figure 2
Figure 2
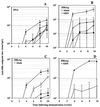
Kinetics and strength of anti-HBs humoral responses in BALB/c mice that responded to immunization with either HBsAg protein with alum and/or CpG ODN as adjuvant(s) or an HBsAg-expressing DNA vaccine. Mice were immunized at <1 day (•), 3 days (○), 7 days (■), or 14 days (□) after birth, or as adults (▴). Each point represents the group geometric mean for all seroconverted animals (endpoint titer >100) within that group. Titers of anti-HBs antibodies (total IgG) are expressed as the highest plasma dilution that resulted in an absorbance value (OD450) two times greater than that of nonimmune sera, with a cut-off value of 0.05.
Figure 3
Figure 3
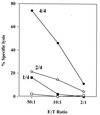
CTL activity in splenocytes removed from BALB/c mice 2 weeks after immunization of 7-day-old mice with protein-alum-CpG (•), protein-alum (■), protein-CpG (□), or a DNA vaccine (○). All mice were given in vivo restimulation (1 μg HBsAg without adjuvant) 3 days before removal of the spleen. Each point represents the mean of values obtained from CTL-positive mice that were each assayed in triplicate. Fraction of CTL-positive mice is indicated for each line. E/Ts are indicated on the horizontal axis. The vertical axis shows HBsAg-specific lysis as a percentage of the total possible lysis.

References

    1. Hunt D W, Huppertz H I, Jiang H J, Petty R E. Blood. 1994;84:4333–4343. - PubMed
    1. Kovarik J, Siegrist C A. Immunol Today. 1998;19:150–152. - PubMed
    1. Albrecht P, Ennis F A, Saltzman E J, Krugman S. J Pediatr. 1977;91:715–718. - PubMed
    1. Bona C, Bot A. The Immunologist. 1997;5:5–9.
    1. Murphy B R, Olmsted R A, Collins P L, Chanock R M, Prince G A. J Virol. 1988;62:3907–3910. - PMC - PubMed

Publication types

MeSH terms

LinkOut - more resources