. 1998 Dec 22;95(26):15641-6.
doi: 10.1073/pnas.95.26.15641.

Modeling stochastic gene expression: implications for haploinsufficiency

Affiliations

Modeling stochastic gene expression: implications for haploinsufficiency

D L Cook et al. Proc Natl Acad Sci U S A. .

Abstract

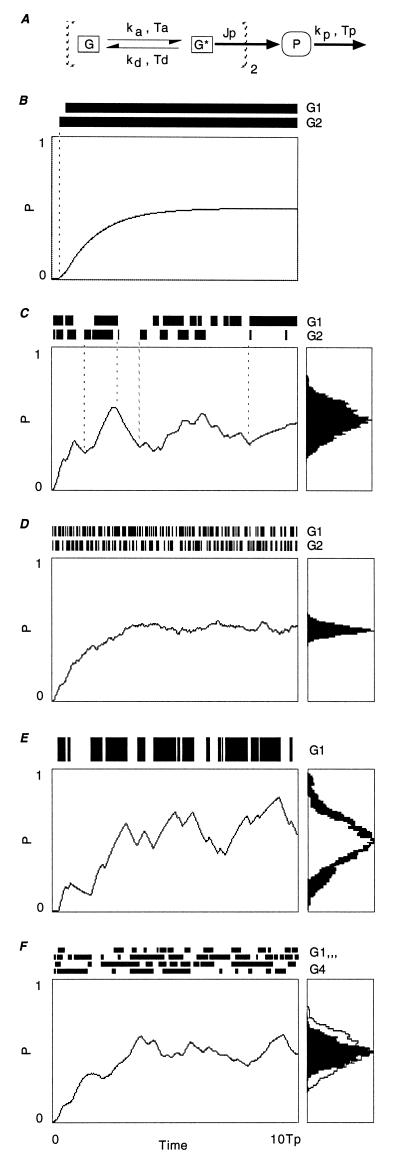
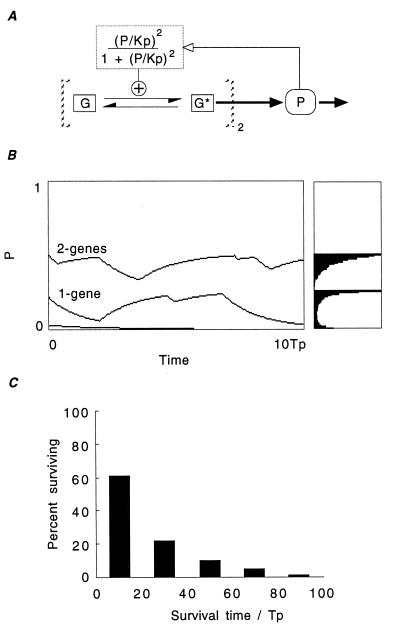
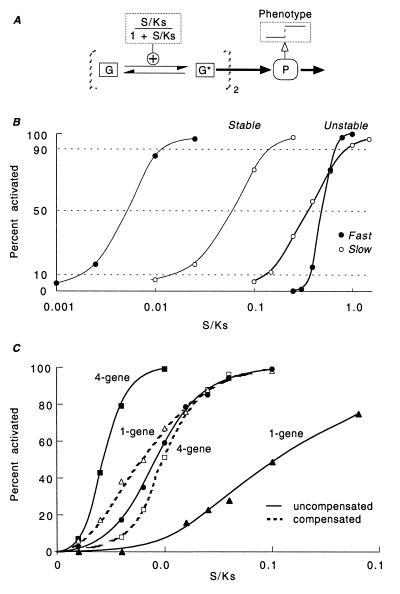
There is increasing recognition that stochastic processes regulate highly predictable patterns of gene expression in developing organisms, but the implications of stochastic gene expression for understanding haploinsufficiency remain largely unexplored. We have used simulations of stochastic gene expression to illustrate that gene copy number and expression deactivation rates are important variables in achieving predictable outcomes. In gene expression systems with non-zero expression deactivation rates, diploid systems had a higher probability of uninterrupted gene expression than haploid systems and were more successful at maintaining gene product above a very low threshold. Systems with relatively rapid expression deactivation rates (unstable gene expression) had more predictable responses to a gradient of inducer than systems with slow or zero expression deactivation rates (stable gene expression), and diploid systems were more predictable than haploid, with or without dosage compensation. We suggest that null mutations of a single allele in a diploid organism could decrease the probability of gene expression and present the hypothesis that some haploinsufficiency syndromes might result from an increased susceptibility to stochastic delays of gene initiation or interruptions of gene expression.


Figures

Figure 1
Figure 1
A stochastic model of gene expression. (A) This minimal model of stochastic gene expression kinetics consists of a pool of product, P, and two identical genes (indicated by brackets and the subscript 2). P is degraded according to first-order kinetics with a half time, Tp. (For a first-order process, the rate constant corresponding to a half time, T, is k = log2/T.) Each gene functions independently of the other and can be inactive (G) or active (G*). Each active gene expresses P at a rate Jp (in nM/s, for instance) so that, if two genes are active, then the net rate of P-synthesis is twice Jp. Genes switch spontaneously between active and inactive state according to first-order kinetics with an activation half time of Ta and a deactivation half time of Td (and corresponding rate constants, ka and kd). (B) Both genes (G1 and G2) are initially inactive and then are allowed to activate (as indicated by the black bars at the top) independently and randomly with a half time, Ta, that is 1/4 the half time of product degradation (i.e., Ta = Tp/4). In this simulation, the deactivation rate (kd) was 0 and expression was stable after activation. (C) The deactivation half time was set to match the activation half time used in A (i.e., Td = Ta = Tp/4) so that, in the steady state, each gene is active on average 50% of the time [Ta/(Ta + Td)]. Jp was doubled from its value in B to maintain an average steady-state P level of 0.5. Stochastic activation and deactivation events for each gene (indicated by the intermittent black lines) produced a “noisy” pattern of product accumulation and depletion. To the right, an amplitude histogram (accumulated in the steady state for a period of 250 Tp) shows the dispersion, or variance, of the product accumulated over time, i.e., the expression noise. (D) Activation and deactivation kinetics that were 10× faster than in A (i.e., Ta = Td = Tp/40, or fast-unstable kinetics) created such brief active and inactive periods that the product level changed only slightly. This markedly reduced product variance, as seen in the decreased variance of the amplitude histogram. (E) When a single gene synthesized product with the same kinetics as in C, the dispersion of expression noise increased as seen by comparing the black histogram with the white histogram taken from C. (F) When the same overall synthesis rate was distributed among four genes, the expression noise was reduced compared with that of two genes (C).
Figure 2
Figure 2
Maintenance of autoregulated gene expression is sensitive to copy number in a stochastic manner. (A) The model of Fig. 1 was modified to simulate simultaneous binding (with affinity Kp) of two P molecules to a receptor that activates gene expression, and the expression deactivation rate was decreased 10-fold (Td = 10Tp/4) to simulate a relatively stable gene with infrequent expression lapses. The expression rate, Jp, was decreased to 12.2 to maintain an average product level of ≈0.5 uP. Setting Kp = 0.2 of the full-scale value of P = 1.0 established an all-or-none activation/deactivation threshold at a value Pth = 0.05. (B) When two genes were active (upper trace and histogram), P levels were maintained well above the threshold, and the genes were expressed indefinitely. However, when one gene was inactivated, random lapses of expression allowed P levels to fall below the threshold level (lower trace continued as a second line, and lower histogram). (C) Histogram of survival times for 100 trials of a one-gene model starting with active expression and an initial P of 0.25 (the steady-state level of P for persistent expression). As expected for a stochastic process, survival times were distributed exponentially where ≈63% of trials lasted less than the average survival time of ≈23 Tp.
Figure 3
Figure 3
Gene instability increased the predictability of a threshold response to a gradient. (A) The model of Fig. 1A was augmented so that a stimulus, S, activated gene transcription while accumulation of product above a threshold level (set to Pth = 0.25 uP for B and Pth = 0.05 uP for C) triggered the all-or-none activation of a “phenotype.” S was assumed to bind reversibly to a single-site receptor and activate gene transcription according to formula image Thus, at saturating levels of S, the Ta is Tp/4 (for slow gene activation, as in Fig. 1C) or Tp/40 (fast gene activation, as in Fig. 1D). If the receptor is 10% occupied, then the genes will be 9.1% active and behave as in B and C. (B) The ability of the stimulus to activate the phenotype was assessed in 100 trials at different values of S/Ks (on a log scale) for stable and unstable, fast and slow gene transcription. Although fast-stable transcription was more sensitive (i.e., activation occurs at lower stimulus levels), fast-unstable gene transcription dramatically sharpens discrimination at higher levels of S/Ks. (C) Curves on a linear S/Ks scale show the percentage of times that the threshold amount of product (0.05 uP, or 10% of the steady-state level of product produced by the two gene fast-unstable model at saturating stimulus) was reached in 100 simulations. Curves are shown for simulations of one gene (triangles), two genes (circles), and four genes (squares) without (solid lines) and with (dashed lines) dosage compensation.

References

    1. Beaudet A L. In: Harrison’s Principles of Internal Medicine. Fauci A S, Braunwald E, Isselbacher K J, Wilson J D, Martin J B, Kasper D L, Hauser S L, Longo D L, editors. New York: McGraw–Hill; 1998. pp. 365–395.
    1. Ko M S H, Nakauchi H, Takahashi N. EMBO J. 1990;9:2835–2842. - PMC - PubMed
    1. Fiering S, Northrop J P, Nolan G P, Mattila P S, Crabtree G R, Herzenberg L A. Genes Dev. 1990;4:1823–1834. - PubMed
    1. van Roon M A, Aten J A, van Oven C H, Charles R, Lamers W H. Dev Biol. 1989;136:508–516. - PubMed
    1. Dingemanse M A, de Boer P A, Moorman A F, Charles R, Lamers W H. Differentiation. 1994;56:153–162. - PubMed

Publication types

LinkOut - more resources