. 1998 Dec 22;95(26):15659-64.
doi: 10.1073/pnas.95.26.15659.

Obesity and mild hyperinsulinemia found in neuropeptide Y-Y1 receptor-deficient mice

Affiliations

Obesity and mild hyperinsulinemia found in neuropeptide Y-Y1 receptor-deficient mice

A Kushi et al. Proc Natl Acad Sci U S A. .

Abstract

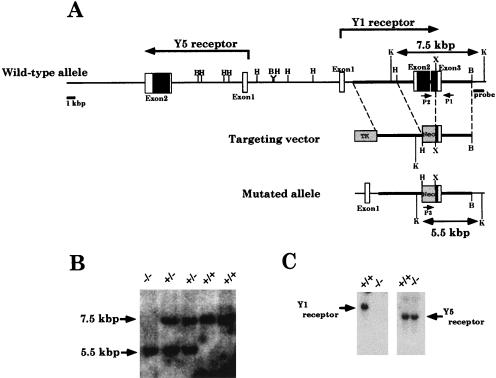
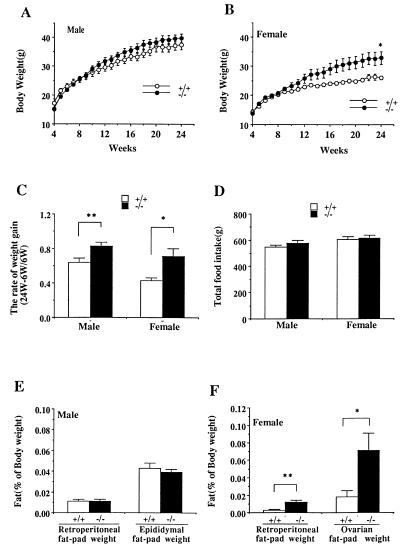
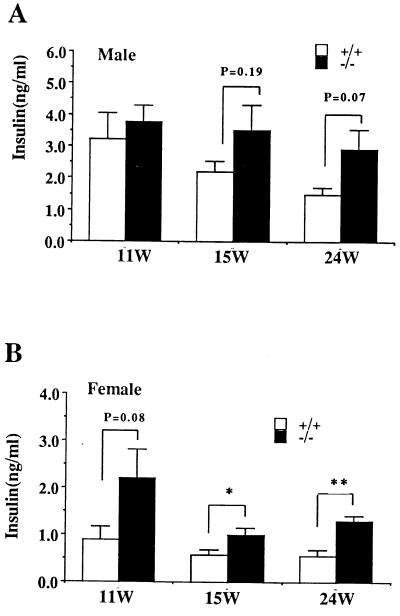
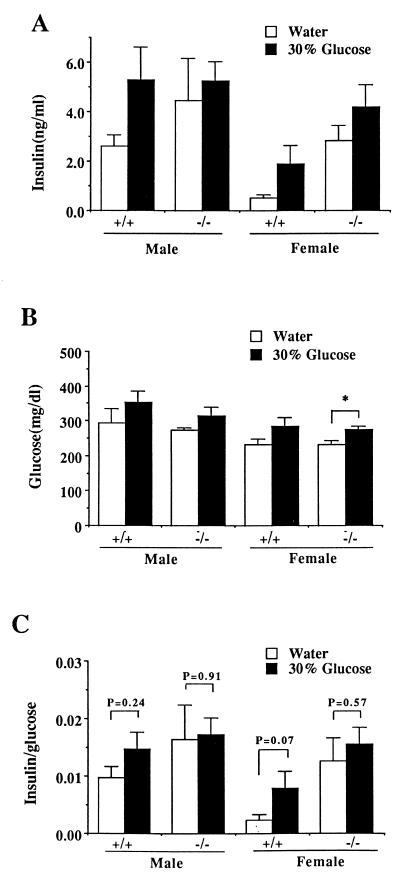
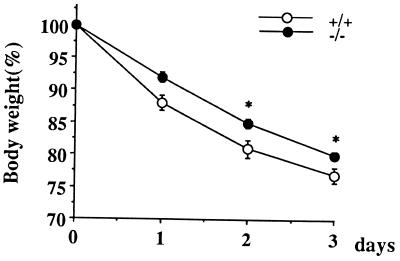
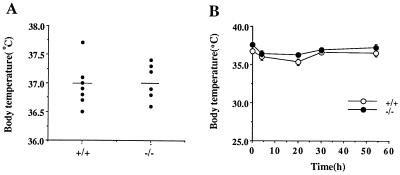
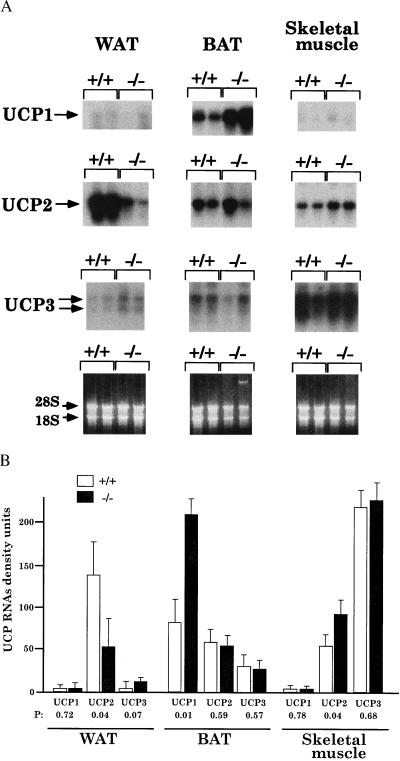
To elucidate the role of neuropeptide Y (NPY)-Y1 receptor (Y1-R) in food intake, energy expenditure, and other possible functions, we have generated Y1-R-deficient mice (Y1-R-/-) by gene targeting. Contrary to our hypothesis that the lack of NPY signaling via Y1-R would result in impaired feeding and weight loss, Y1-R-/- mice showed a moderate obesity and mild hyperinsulinemia without hyperphagia. Although there was some variation between males and females, typical characteristics of Y1-R-/- mice include: greater body weight (females more than males), an increase in the weight of white adipose tissue (WAT) (approximately 4-fold in females), an elevated basal level of plasma insulin (approximately 2-fold), impaired insulin secretion in response to glucose administration, and a significant changes in mitochondrial uncoupling protein (UCP) gene expression (up-regulation of UCP1 in brown adipose tissue and down-regulation of UCP2 in WAT). These results suggest either that the Y1-R in the hypothalamus is not a key molecule in the leptin/NPY pathway, which controls feeding behavior, or that its deficiency is compensated by other receptors, such as NPY-Y5 receptor. We believe that the mild obesity found in Y1-R-/- mice (especially females) was caused by the impaired control of insulin secretion and/or low energy expenditure, including the lowered expression of UCP2 in WAT. This model will be useful for studying the mechanism of mild obesity and abnormal insulin metabolism in noninsulin-dependent diabetes mellitus.


Figures

Figure 1
Figure 1
Disruption of Y1-R gene in mice. (A) Partial restriction map of the allele of wild-type Y1-R and Y5-R genes (Top), the targeting construct (Middle), and the predicted homologous recombinant allele (Bottom). The closed and open boxes indicate coding and noncoding regions in the exons, respectively. Pertinent restriction enzyme sites are noted (B, BamHI; H, HindIII; X, XhoI; K, KpnI). P1, P2, and P3 indicate the positions of the PCR primers used in genotyping. (B) Southern blot analysis of DNA from the tails of Y1-R+/+, Y1-R+/−, and Y1-R−/− mice using the 3′ probe indicated in A. Wild-type (7.5 kbp) and recombinant (5.5 kbp) KpnI-digested fragments were identified. (C) Northern blot analysis of Y1-R and Y5-R mRNA expressions in Y1-R+/+ and Y1-R−/− mouse brain. Y1-R and Y5-R mRNAs were identified by using Y1-R and Y5-R cDNAs as probes, respectively (14, 15).
Figure 2
Figure 2
Body weight, food consumption, and adipose tissue mass of Y1-R+/+ and Y1-R−/− mice. (A and B) Growth curves of Y1-R+/+ (males: n = 8; females: n = 7) and Y1-R−/− (males: n = 10; females: n = 8) mice from 4 to 24 weeks of age (A: males; B: females). Each data point is the mean ± SE, and ∗ indicate values of statistical significance (P < 0.05), as determined by two-tailed unpaired Student’s t tests. (C) The rate of weight gain between 6 and 24 weeks of Y1-R−/− and Y1-R+/+ mice. Each data point is the mean ± SE, and ∗ indicate values of statistical significance (∗, P < 0.05, ∗∗, P < 0.01), as determined by two-tailed unpaired Student’s t tests. (D) The food intake of Y1-R+/+ (males: n = 8; females: n = 7) and Y1-R−/− (males: n = 10; females: n = 8) mice were monitored over a 20-week period (4–24 weeks). All values are means ± SE. A two-tailed unpaired Student’s t test was used for statistical analysis. (E and F) After measurement of body weight, the fat pads from the indicated sites were weighed (E: males; F: females). ∗, P < 0.05; ∗∗, P < 0.01.
Figure 3
Figure 3
Analysis of the plasma insulin for Y1-R+/+ and Y1-R−/− mice. Insulin levels for each type of mouse at ages 11, 15, and 24 weeks (A: males; B: females). The blood was collected from Y1-R+/+ (males: n = 8; females: n = 7) and Y1-R−/− (males: n = 10; females: n = 8) mice provided with food and water. All values are means ± SE. A two-tailed unpaired Student’s t test was used for statistical analysis. ∗, P < 0.05; ∗∗, P < 0.01.
Figure 4
Figure 4
Glucose tolerance tests for Y1-R+/+ and Y1-R−/− mice at 31 weeks of age. Half of wild-type (three males and five females) and deficient (four males and five females) mice (29 weeks of age) were given a 30% glucose solution instead of plain water for 2 weeks. Insulin (A) and glucose (B) levels with or without the administration of 30% glucose, respectively (∗, P < 0.05). (C) The effect of the administered glucose on insulin secretion. The ratio of plasma insulin level (A) to blood glucose level (B) (insulin/glucose ratio) was estimated to determine the capability of insulin secretion in response to glucose administration. All values are means ± SE. A two-tailed unpaired Student’s t test was used for statistical analysis.
Figure 5
Figure 5
Feeding efficiency of Y1-R+/+ and Y1-R−/− mice. To analyze the rate of weight loss when food was restricted, Y1-R−/− (n = 6) and Y1-R+/+ (n = 10) mice at 6–8 weeks of age were fed an amount of CRF-1 powder equal to 5% of body weight. All values are means ± SE. A two-tailed unpaired Student’s t test was used for statistical analysis. ∗, P < 0.05.
Figure 6
Figure 6
Thermoregulation in female deficient mice. (A) Thermoregulation at an ambient temperature of 23°C [Y1-R−/− (n = 6) and Y1-R+/+ (n = 7)]. (B) Thermoregulation during cold (4°C) exposure [Y1R−/− (n = 6) and Y1-R+/+ (n = 7)].
Figure 7
Figure 7
(A) Northern blot analysis of UCP1, UCP2, and UCP3 mRNAs in BAT, WAT, and skeletal muscle. Total RNA was isolated from the BAT, WAT, and skeletal muscle of Y1-R+/+ and Y1-R−/− female mice (18–45 weeks old) kept at 23°C by using the guanidinium thiocyanate method. Five micrograms of total RNA per lane was used for these experiments. (B) Bar graph showing the comparison of mRNA levels of UCP1, UCP2, and UCP3 in WAT, BAT, and skeletal muscle of Y1-R+/+ and Y1-R−/− female mice. Data are presented as the mean ± SE of estimates for six female mice for WAT and BAT and three mice for skeletal muscle. A two-tailed unpaired Student’s t test was used for statistical analysis.

References

    1. Dumont Y, Martel J C, Fournier A, St. Pierre S, Quirion R. Prog Neurobiol. 1992;38:125–167. - PubMed
    1. Wahlestedt C, Reis D J. Annu Rev Pharmacol Toxicol. 1993;32:309–352. - PubMed
    1. Leibowitz S F. Brain Res Bull. 1991;27:333–337. - PubMed
    1. Wahlestedt C, Merlo Pich E, Koob G F, Yee F, Heeilig M. Science. 1993;259:528–530. - PubMed
    1. McDermott B J, Millar B C. Cardiovasc Res. 1993;27:893–905. - PubMed

MeSH terms