. 1998 Dec 22;95(26):15706-11.
doi: 10.1073/pnas.95.26.15706.

Information about movement direction obtained from synchronous activity of motor cortical neurons

Affiliations

Information about movement direction obtained from synchronous activity of motor cortical neurons

N G Hatsopoulos et al. Proc Natl Acad Sci U S A. .

Abstract

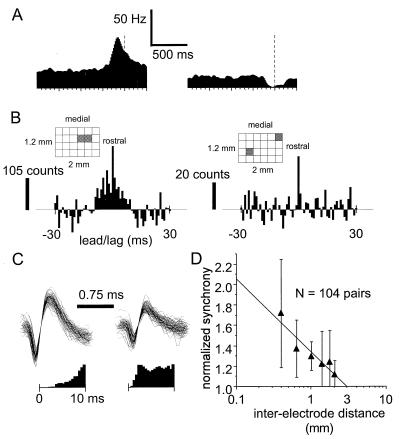
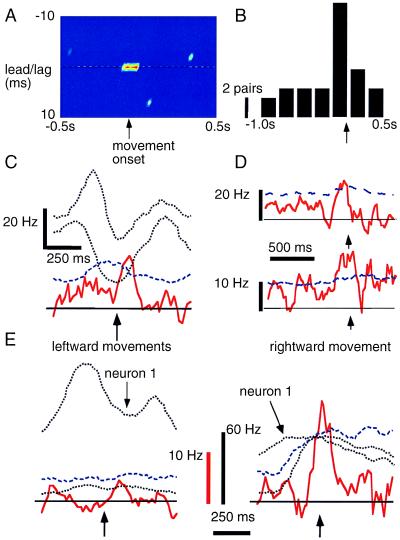
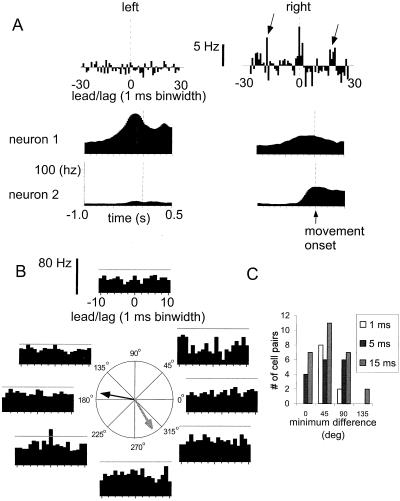
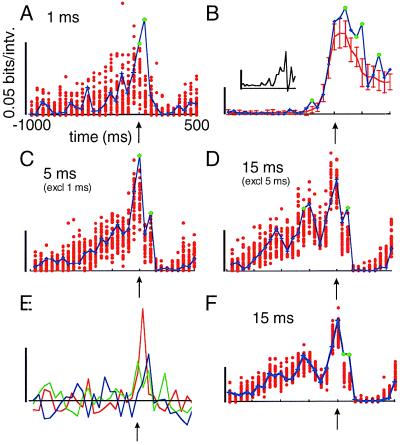
Although neuronal synchronization has been shown to exist in primary motor cortex (MI), very little is known about its possible contribution to coding of movement. By using cross-correlation techniques from multi-neuron recordings in MI, we observed that activity of neurons commonly synchronized around the time of movement initiation. For some cell pairs, synchrony varied with direction in a manner not readily predicted by the firing of either neuron. Information theoretic analysis demonstrated quantitatively that synchrony provides information about movement direction beyond that expected by simple rate changes. Thus, MI neurons are not simply independent encoders of movement parameters but rather engage in mutual interactions that could potentially provide an additional coding dimension in cortex.


Figures

Figure 1
Figure 1
(A) Firing rate modulation of two simultaneously recorded MI neurons showing a movement related increase (Left side) and decrease (Right side). Peri-event time histograms are aligned on movement onset (dashed line) and are based on movements in a single direction. (B) Range of temporal precision of synchrony for pairs of recorded neurons. The relative positions of the recording sites on the array are shown as gray boxes on a grid. Below are shown CCHs between two pairs of neurons. A trial-based shift predictor representing the expected number of chance coincidences has been subtracted from the histograms. Broadly correlated discharge peaked at zero time lag (1 ms bin widths) (Left side), computed from data in the interval from trial start to the end of movement for all movement directions. Sharply correlated discharge at zero time lag (Right side). In this example, the data is restricted to a 700-ms interval after the go cue for a single movement direction. (C) All synchronous extracellular waveforms (±500 μs) recorded from two electrode sites that were used to compute the histogram on the Right side of B. These waveforms were recorded during a single recording session. Synchronous and nonsynchronous waveforms for both neurons were not different in initial peak amplitude (two-tailed t test, P < .01). Autocorrelation functions are shown below. (D) Synchronous interactions between neurons is evident at sites up to 3 mm apart. The strength of synchrony (normalized) shows a negative log-linear relationship with inter-electrode distance. Normalized synchrony values were computed by taking the ratios of the cross-correlation value at zero time lag (1 ms bin width) to the trial-based shift predictor value. Data were taken from a 700-ms period about movement onset. Error bars represent one SD.
Figure 2
Figure 2
Temporal modulation in synchrony over a trial. (A) A cross-correlogram between two single units. The x-axis represents time with respect to movement onset; the y-axis is lead/lag time in correlation; and color denotes the correlation strength (red is maximal and dark blue denotes nonsignificant values). Notice the transient increase in correlation around zero time lag (i.e., synchrony) at around movement onset. (B) Peaks in synchrony occur most often around the time of movement onset. This histogram (300 ms bin width) tabulates the times during the trial at which significant peaks in synchrony occurred with respect to movement onset (arrow). Significant peaks were defined as zero time lag correlation values (3 ms bin width) that crossed the upper bound of the 99% confidence limit. (C) Variations in synchrony are distinct from firing rate modulation. Sliding cross-correlation values (red line) at zero-time lag (i.e., synchrony) between two neurons are plotted along with their firing rates (black dotted lines) for movements to the left. The 99% confidence limit (dashed blue line) also is shown. Similar formats are used in D and E. (D) Different patterns of synchrony (red line) between one cell and two other simultaneously recorded neurons. Data from all 8 directions movement directions were pooled to compute cross correlations. (E) Pattern of synchrony across the trial varies with movement direction. Shown are synchrony values and firing rates between a given cell pair for leftward movements (Left side) and rightward movements (Right side). The red scale bar refers to synchrony magnitudes whereas the black bar refers to firing rates of the individual neurons. (C-E) Synchrony values are based on 3 ms bin widths and have been subtracted by the shift predictor. Vertical arrows indicate movement onset.
Figure 3
Figure 3
Two examples of directional tuning in synchrony. (A) CCHs computed from two cells recorded during movements to the left and right during a 1-sec period around movement onset. Side bands (see arrows) in the CCH for movements to the right indicate oscillations. Below each CCH, the peri-movement time histograms are plotted for each of the two neurons. (B) CCHs between one pair of neurons computed over ±200-ms period with respect to movement onset for each movement direction. The 99% confidence limit (gray line) assumes independence of firing of the two cells. This pair of neurons exhibits strong synchrony for movements in the 225 degree direction. In contrast, the constituent cells have preferred directions on either side (170 and 293 degrees, gray and dark arrows, respectively). The shift predictor has not been subtracted in these histograms. (C) The number of directionally tuned cell pairs as a function of the difference between the direction of peak synchrony and the direction of the cell’s peak firing rate which is closest to the peak synchrony direction.
Figure 4
Figure 4
Synchronous discharge carries directional information beyond that expected by firing rate alone. (A) The temporal evolution of mutual information between synchrony defined at 1 ms precision and movement direction (blue crosses and line) and trial-shuffled estimates of mutual information (red dots) for a single pair of neurons. The mutual information is significantly (P < 0.03) larger than chance at around movement onset (green dots). (B) In another cell pair, a sustained level of significant mutual information is observed after movement onset by using a 5 ms temporal precision. The means and SDs of the trial-shuffled estimates are shown in red. (Inset) The difference between the mutual information and the mean of the shuffled estimates. (C and D) The temporal evolution of mutual information for the same cell pair used in A by using a 5 ms bin width excluding coincident spikes at 1 ms precision and by using a 15 ms bin width excluding coincident spikes at 5 ms precision, respectively. (E) Z-scores of mutual information derived from the pair of neurons used in A, C, and D for all three levels of temporal precision: 1 ms (red), 5 ms exclusive of 1 ms synchrony (blue), and 15 ms exclusive of 5 ms synchrony (green), respectively. Scale bar represents a z-score of 4. Z-scores were computed by subtracting the mean from the estimates of mutual information and normalizing for variance. This measure reveals the additional information about direction that occurs at movement onset that exceeds chance. (F) For the same cell pair used in A, C, and D, all three levels of temporal precision together were used to estimate the mutual information between synchronous spikes and direction. Scale bar for all graphs except for E represents 0.05 bits/50 ms interval. All figures except for B are based on a two-direction task (i.e., 1-bit task). Figure B is based on an eight-direction task (i.e., 3-bit task).

Comment in

References

    1. Fu Q-G, Flament D, Coltz J D, Ebner T J. J Neurophysiol. 1995;73:836–854. - PubMed
    1. Fu Q-G, Suarez J I, Ebner T J. J Neurophysiol. 1993;70:2097–2116. - PubMed
    1. Thach W T. J Neurophysiol. 1978;41:654–676. - PubMed
    1. Evarts E V. In: Handbook of Physiology. Brooks V B, editor. Vol. 2. Washington, DC: Am. Physiol. Soc.; 1981. pp. 1083–1120.
    1. Georgopoulos A P, Kalaska J F, Caminiti R, Massey J T. J Neurosci. 1982;2:1527–1537. - PMC - PubMed

Publication types

LinkOut - more resources