. 1998 Dec 22;95(26):15741-6.
doi: 10.1073/pnas.95.26.15741.

Fluctuations and stimulus-induced changes in blood flow observed in individual capillaries in layers 2 through 4 of rat neocortex

Affiliations

Fluctuations and stimulus-induced changes in blood flow observed in individual capillaries in layers 2 through 4 of rat neocortex

D Kleinfeld et al. Proc Natl Acad Sci U S A. .

Erratum in

  • Proc Natl Acad Sci U S A. 1999 Jul 6;96(14):8307

Abstract

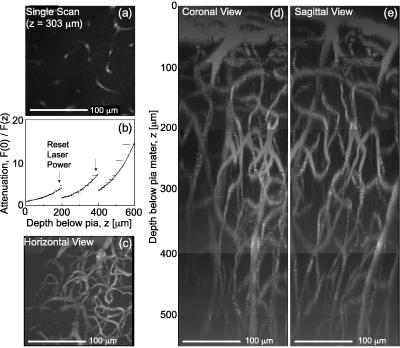
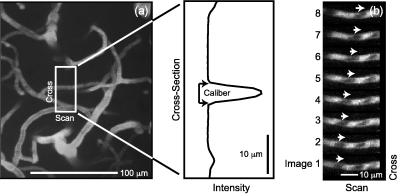
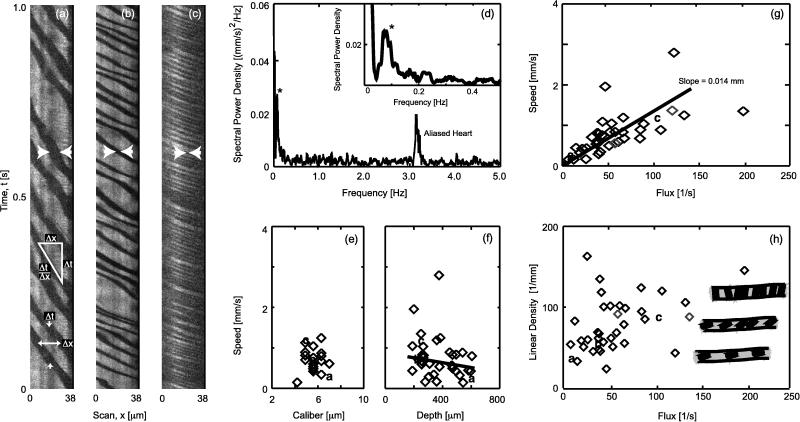
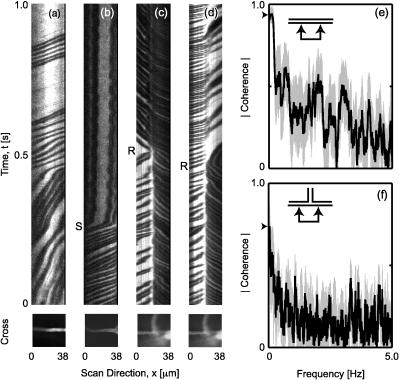
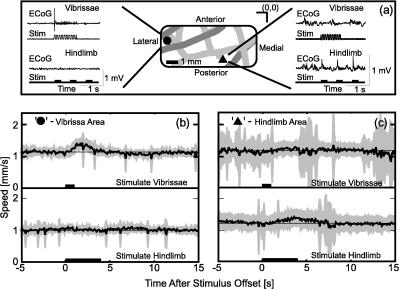
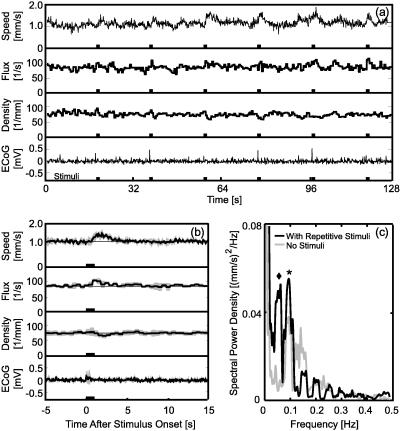
Cortical blood flow at the level of individual capillaries and the coupling of neuronal activity to flow in capillaries are fundamental aspects of homeostasis in the normal and the diseased brain. To probe the dynamics of blood flow at this level, we used two-photon laser scanning microscopy to image the motion of red blood cells (RBCs) in individual capillaries that lie as far as 600 micrometers below the pia mater of primary somatosensory cortex in rat; this depth encompassed the cortical layers with the highest density of neurons and capillaries. We observed that the flow was quite variable and exhibited temporal fluctuations around 0.1 Hz, as well as prolonged stalls and occasional reversals of direction. On average, the speed and flux (cells per unit time) of RBCs covaried linearly at low values of flux, with a linear density of approximately 70 cells per mm, followed by a tendency for the speed to plateau at high values of flux. Thus, both the average velocity and density of RBCs are greater at high values of flux than at low values. Time-locked changes in flow, localized to the appropriate anatomical region of somatosensory cortex, were observed in response to stimulation of either multiple vibrissae or the hindlimb. Although we were able to detect stimulus-induced changes in the flux and speed of RBCs in some single trials, the amplitude of the stimulus-evoked changes in flow were largely masked by basal fluctuations. On average, the flux and the speed of RBCs increased transiently on stimulation, although the linear density of RBCs decreased slightly. These findings are consistent with a stimulus-induced decrease in capillary resistance to flow.


Figures

Figure 1
Figure 1
Reconstruction of labeled vessels in primary vibrissa cortex. (a) A 170 μm × 170 μm single planar scan at a depth of 303 μm below the pia. The dark stripes in vessels correspond to the location of unlabeled RBCs at the time of the scan. (b) Attenuation of the measured fluorescent intensity as a function of depth. We acquired planar scans as in a at successive 1-μm intervals below the pia, and determined the mode of the distribution of measured amplitudes for each image. We plot the inverse of the intensity at the mode at each depth. The jumps in the data (↓) correspond to a manual increase in the incident laser power. The solid line is a fit to the data, with F(0)/F(z) = exp{z/λ} and a constant attenuation length (λ = 140 μm). (c) Horizontal view (x–y projection) of the microvasculature in three dimensions reconstructed from the set of planar scans used in a and b. We corrected each scan for attenuation with depth (see Methods) and calculated the maximum intensity in the x–y plane for sections 50–550 μm below the pia. (d and e) Coronal and sagittal views (x–z and y–z projections, respectively) of the microvasculature reconstructed from the set of planar scans as in a. We corrected each scan for the attenuation with depth and calculated the maximum intensity in the x–z and y–z planes for sections 0–550 μm below the pia.
Figure 2
Figure 2
Illustration of individual capillaries and RBC flow in a capillary. (a) Horizontal view in the vicinity of a capillary reconstructed from a set of 100 planar scans acquired every 1 μm between 310 and 410 μm. The Inset shows the intensity profile along the cross section for the scan that passed through the central axis of the capillary in question (z = 360 μm). The caliber is estimated from the number of pixels with intensity above the background level, as noted. (b) Successive planar images through a small vessel, acquired every 16 msec. The change in position of a particular unstained object, interpreted as a RBC, is indicated by the series of arrows (→); the velocity of the RBC is +0.11 mm/sec. Depth = 450 μm.
Figure 3
Figure 3
Characterization of the basal motion of RBCs in capillaries. The vessels were scanned at 2 msec per line, except for one vessel with very fast flow that was scanned at 1 msec per line. (ac) Selected 1-sec segments of the line-scan data for flow in three different vessels. Note the increase in speed and flux in the progression from a to c. The width of the dark bands (distance between arrows) is seen to decrease with increasing flux; this implies that the profile of the RBCs relative to the central axis of the capillary decreases in the progression a to c. The Inset in a is a characterization of RBC flow. The instantaneous velocity is Δxt, the flux is 1/Δt, and the linear density is 1/Δx. (d) Representative plot of the spectral power density in a 128-sec record of speed versus time; we used multitaper estimation techniques (36) with a half-bandwidth of 0.02 Hz. Note the peak near 0.1 Hz (∗); the peak at 3.2 Hz is aliased heart rate (6.8 Hz aliased to 3.2 Hz by the T = 100-msec window of the velocity calculation). (e) Plot of speed versus caliber for 21 vessels. The speed was determined from 20-sec intervals that included no sensory stimuli. a, b, and c refer to data for the line-scans in a, b, and c, respectively. (f) Plot of speed versus depth below the pia for flow in all 38 vessels. The solid line is a fit to the data, excluding the two points with exceptionally high speed, with slope 0.007 ± 0.0004 (mm/sec)/μm (mean ± SEM). (g) Plot of speed versus flux. The solid line is a best fit to all points in the data set. (h) Plot of linear density (Eq. 1) versus flux. The drawings illustrate the change in packing that was hypothesized to occur as the RBCs shift their orientation from planar at low density to axial at high density.
Figure 4
Figure 4
Examples of highly variable flow. (a) A 1-sec segment of the line-scan data through a straight section of a capillary in which the speed changes from relatively slow (large slope) to fast (small slope). The image below the line-scan record is the average of 100 planar scans that include the axis of the capillary. Depth = 240 μm. (b) A 1-sec segment of data at the onset of a transient stall in flow (S). Note that the RBCs remain stuck in the vessel. Depth = 260 μm. (c) A 1-sec segment of data that shows the flow in two collinear arms of a junction. Note the reversal in the direction of flow in the arm on the left (R). Depth = 260 μm. (d) Segment of flow in the same capillary junction as in c acquired approximately 200 sec later. Multiple reversals in the direction of flow in the right arm were seen, one of which is shown (R). (e) Trial-averaged (n = 8) spectral coherence between two ≈10-μm segments in a straight vessel separated by a center-to-center distance of 25 μm. The thick line is the magnitude of the mean coherence and the gray band indicates one SD in the trial average (n = 8). The arrow indicates the coherence at zero frequency. We used multitaper spectral estimation techniques (36) with a half-bandwidth of 0.04 Hz; the SD is a jackknife estimate (37). (f) Trial-averaged (n = 4) spectral coherence between the velocity in right versus left arms of the junction shown in c and d.
Figure 5
Figure 5
The regional specificity of stimulus-induced changes in the speed of RBCs. (a) Example of the procedure for mapping the somatotopy of parietal cortex. A ball electrode was placed at various locations on the cortical surface that were noted by reference to the surface vasculature [Inset; (0,0) indicates the Bregma point]. For each location, we show the ECoG for stimulation of the vibrissa and for stimulation of the hindlimb (see Methods). The lateral location is seen to respond solely to stimulation of the contralateral vibrissae, and the medial-posterior region responds solely to strokes on the contralateral hindlimb. (b) Trial-averaged speed for a capillary in the vibrissa area (• in a) in response to vibrissa (Upper) or hindlimb (Lower) stimulation. The dark line is the average over 12 trials, and the gray band is the SD of the trial average. The spikes in the SD are caused by the many trials containing a brief stall. Depth = 255 μm. (c) Trial-averaged speed for a capillary in the hindlimb (• in a) in response to vibrissa (Upper) or hindlimb (Lower) stimulation. Twenty-four trials were averaged for each stimulus. Depth = 260 μm.
Figure 6
Figure 6
The nature of the single-trial response of RBC flow to vibrissa stimulation. We recorded from the equivalent of the area denoted • in Fig. 5a. (a) A complete 128-sec record with six separate stimuli, spaced 20 sec apart. Shown are the speed, the flux, the linear density [computed as flux/speed (Eq. 1)], and the ECoG (recorded from a site ≈2 mm lateral to the optical measurement). Depth = 255 μm. (b) Trial average of the quantities shown in a. The dark line is the average over all six trials; the gray band is the SD of the trial average, and the thin straight line is drawn through the prestimulus portion of the data. Depth = 255 μm. (c) Spectral power for the speed shown in a (black line) along with the power for a record taken immediately after but without simulation (gray line). The ⧫ corresponds to variation in the speed at the 0.05-Hz repetition frequency of the stimulation and the ∗ corresponds to a peak at 0.1 Hz associated with vasomotor oscillations. The half-bandwidth of the spectral estimation was 0.016 Hz.

References

    1. Woolsey T A, Rovainen C M, Cox S B, Henger M H, Liange G E, Liu D, Moskalenko Y E, Sui J, Wei L. Cereb Cortex. 1996;6:647–660. - PubMed
    1. Raichle M E. In: Handbook of Physiology: The Nervous System. Mountcastle V B, Plum F, Geiger S R, editors. Washington, D.C.: Am. Physiol. Soc.; 1987. , Section 1, Vol. 5, pp. 643–674.
    1. Lou H C, Edvinsson L, MacKenzie E T. Ann Neurol. 1987;22:289–297. - PubMed
    1. Villringer A, Dirnagl U. Cereb Brain Metab Rev. 1995;7:240–276. - PubMed
    1. Hudetz A G. Microcirculation. 1997;4:233–252. - PubMed

Publication types

LinkOut - more resources