. 1999 Jan;181(1):197-203.
doi: 10.1128/JB.181.1.197-203.1999.

Protein mobility in the cytoplasm of Escherichia coli

Affiliations

Protein mobility in the cytoplasm of Escherichia coli

M B Elowitz et al. J Bacteriol. 1999 Jan.

Abstract

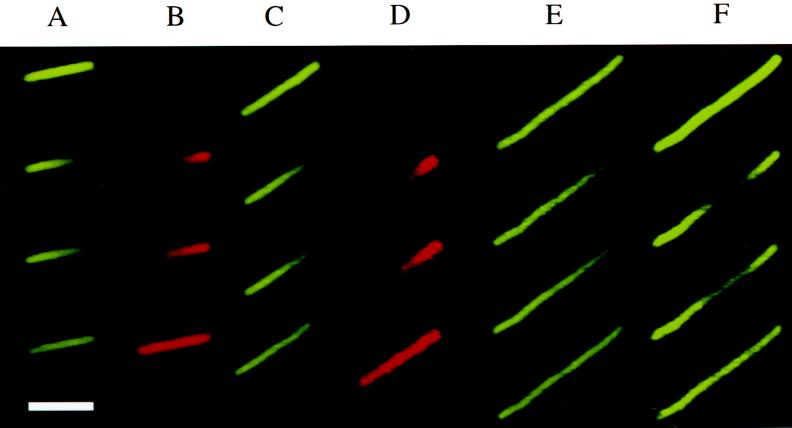
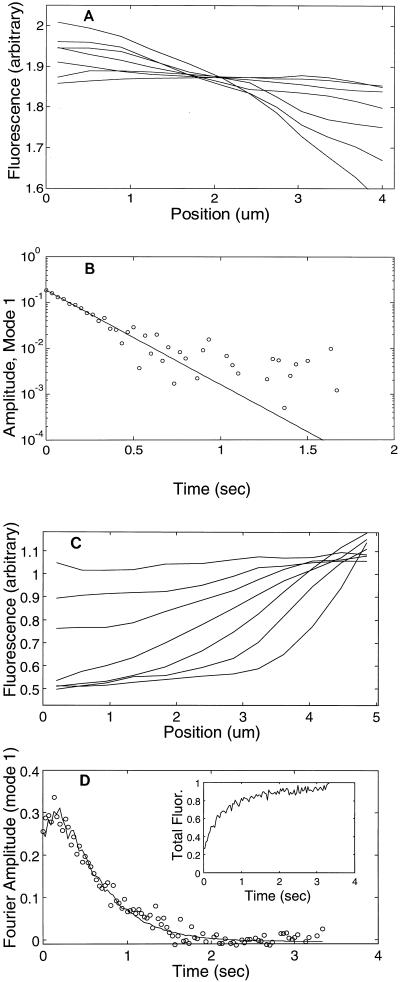
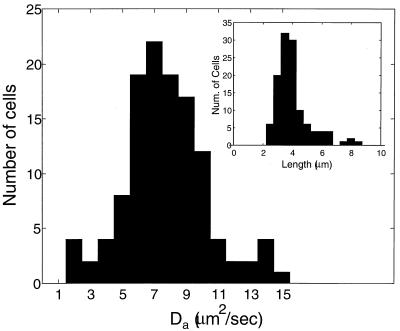
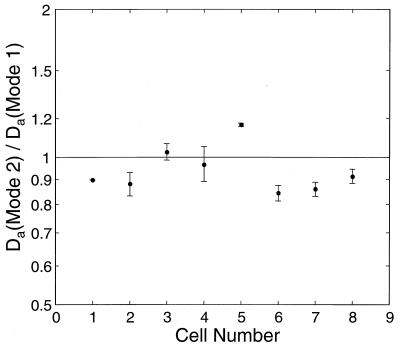
The rate of protein diffusion in bacterial cytoplasm may constrain a variety of cellular functions and limit the rates of many biochemical reactions in vivo. In this paper, we report noninvasive measurements of the apparent diffusion coefficient of green fluorescent protein (GFP) in the cytoplasm of Escherichia coli. These measurements were made in two ways: by photobleaching of GFP fluorescence and by photoactivation of a red-emitting fluorescent state of GFP (M. B. Elowitz, M. G. Surette, P. E. Wolf, J. Stock, and S. Leibler, Curr. Biol. 7:809-812, 1997). The apparent diffusion coefficient, Da, of GFP in E. coli DH5alpha was found to be 7.7 +/- 2.5 microm2/s. A 72-kDa fusion protein composed of GFP and a cytoplasmically localized maltose binding protein domain moves more slowly, with Da of 2.5 +/- 0.6 microm2/s. In addition, GFP mobility can depend strongly on at least two factors: first, Da is reduced to 3.6 +/- 0.7 microm2/s at high levels of GFP expression; second, the addition to GFP of a small tag consisting of six histidine residues reduces Da to 4.0 +/- 2.0 microm2/s. Thus, a single effective cytoplasmic viscosity cannot explain all values of Da reported here. These measurements have implications for the understanding of intracellular biochemical networks.


Figures

FIG. 1
FIG. 1
Snapshots from photobleaching and photoactivation experiments. In each column the first row shows the cell before the laser pulse. The next three images show the cellular fluorescence distribution at subsequent times after the laser pulse. Columns A, C, E, and F show photobleaching (GFP filter set, false color green). Columns B and D show photoactivation (rhodamine filter set, false color red). Columns A to D show two different DH5α cells expressing GFP (A and B show cell 1; C and D show cell 2). Columns E and F show a cephalexin-treated DH5α cell, expressing GFP, being bleached first at the pole (E) and then at the center (F). Time points are as follows (t = 0 is set arbitrarily as the end of the laser pulse). (A) −0.42, 0.05, 0.18, 0.32, and 4.3 s. (B) −0.08, 0.08, 0.35, 0.62, and 4.7 s. (C) −0.5, 0.03, 0.10, 0.23, and 0.83 s. (D) −0.1, 0.03, 0.23, 0.63, and 1.7 s. (E) −0.57, 0.03, 0.43, 0.77, and 2.8 s. (F) −0.57, 0.03, 0.20, 0.37, and 1.8 s. Bar = 4 μm.
FIG. 2
FIG. 2
Analysis of photobleaching (A and B) and photoactivation (C and D) data. (A) Fluorescence intensity profiles at 0.03, 0.1, 0.17, 0.3, 0.5, 0.83, and 1.5 s after the end of photobleaching are shown for a DH5α cell expressing GFP. (B) For the same cell, temporal decay of first Fourier amplitude with time. Circles indicate data points; the solid line is a fit to the exponential function Aexp(−Bt) + C (see Materials and Methods). (C) Photoactivation intensity profiles are shown at the same time points as in panel A. (D) Temporal decay of first Fourier amplitude. The data are shown with circles, and a fit to an exponential decay corrected by the total cellular fluorescence enhancement is shown with a solid line (see Materials and Methods). The inset shows the total cellular fluorescence α(t). In panel B, the total intensity after photobleaching is constant (not shown).
FIG. 3
FIG. 3
Histogram of apparent diffusion coefficients for 120 DH5α cells measured by photobleaching. (Inset) Distribution of cell lengths for the same data. There is no significant correlation between cell length and apparent diffusion coefficient.
FIG. 4
FIG. 4
Ratio of apparent diffusion coefficients from Fourier modes 1 and 2 on single cephalexin-treated cells. Error bars indicate the SD of measurements over several laser pulses on the same cell. (For cells 1 and 5, only one pulse was made; therefore, there are no error bars.)
FIG. 5
FIG. 5
Deviations of individual measurements of a single cell from their average values. For each cell, measurements of Da were made several times. (A) Value of Da obtained with a given measurement (“Pulse Number”) minus the average of all such measurements on the same cell as a function of the pulse number. There are fewer points at higher pulse numbers because fewer cells were subjected to a large (>3) total number of pulses. (B) Histograms of the data shown in panel A, showing the number of points as a function of deviation, for the first four pulses.

References

    1. Allan V. Membrane traffic motors. FEBS Lett. 1995;369:101–106. - PubMed
    1. Alon U, Camarena L, Surette M G, Aguera y Arcas B, Liu Y, Leibler S, Stock J B. Response regulator output in bacterial chemotaxis. EMBO J. 1998;17:4238–4248. - PMC - PubMed
    1. Axelrod D, Koppel D E, Schlessinger J, Elson E, Webb W W. Mobility measurement by analysis of fluorescence photobleaching recovery kinetics. Biophys J. 1976;16:1055–1069. - PMC - PubMed
    1. Brejc K, Sixma T K, Kitts P A, Kain S R, Tsien R Y, Ormo M, Remington S J. Structural basis for dual excitation and photoisomerization of the Aequorea victoria green fluorescent protein. Proc Natl Acad Sci USA. 1997;94:2306–2311. - PMC - PubMed
    1. Casadaban M J, Cohen S N. Analysis of gene control signals by DNA fusion and cloning in Escherichia coli. J Mol Biol. 1980;138:179–207. - PubMed

MeSH terms

LinkOut - more resources