. 1999 Jan;181(1):270-83.
doi: 10.1128/JB.181.1.270-283.1999.

Adaptation of Mycobacterium smegmatis to stationary phase

Affiliations

Adaptation of Mycobacterium smegmatis to stationary phase

M J Smeulders et al. J Bacteriol. 1999 Jan.

Abstract

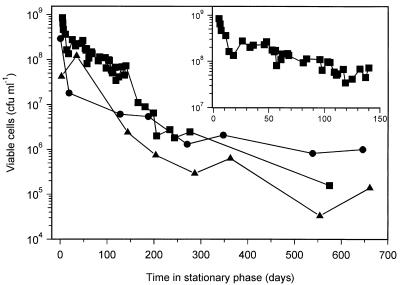
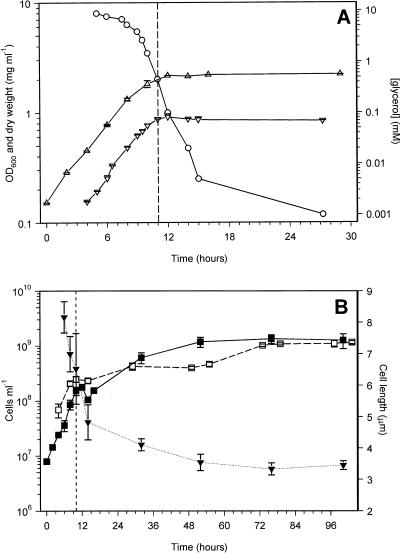
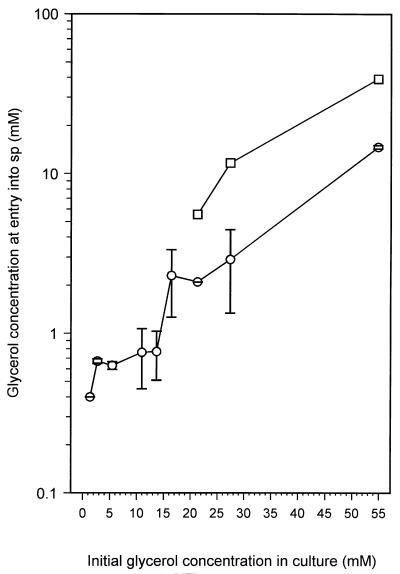
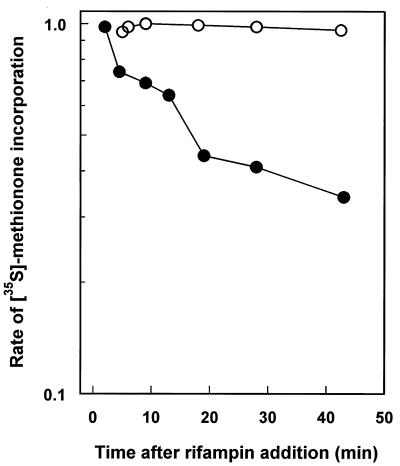
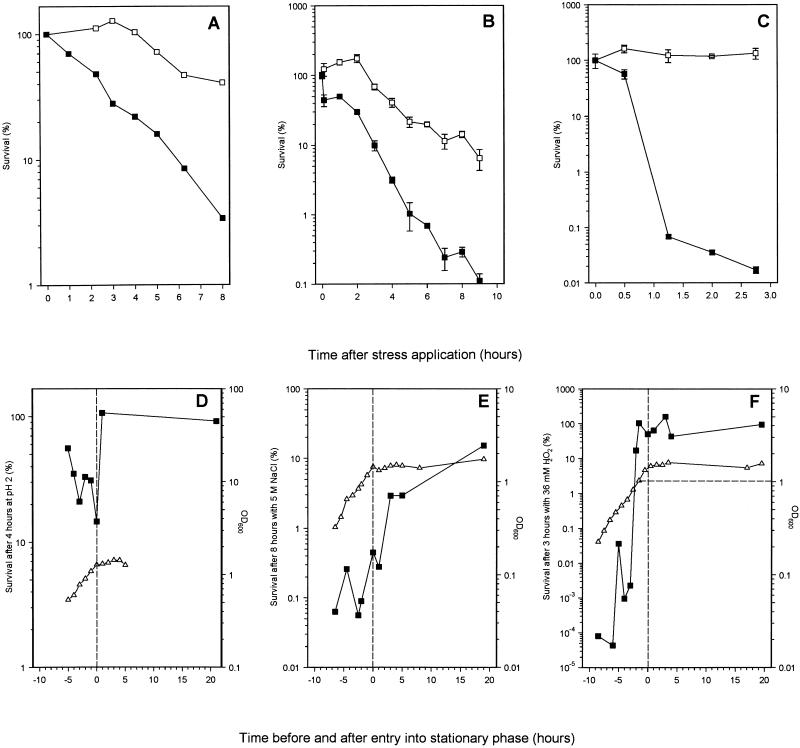
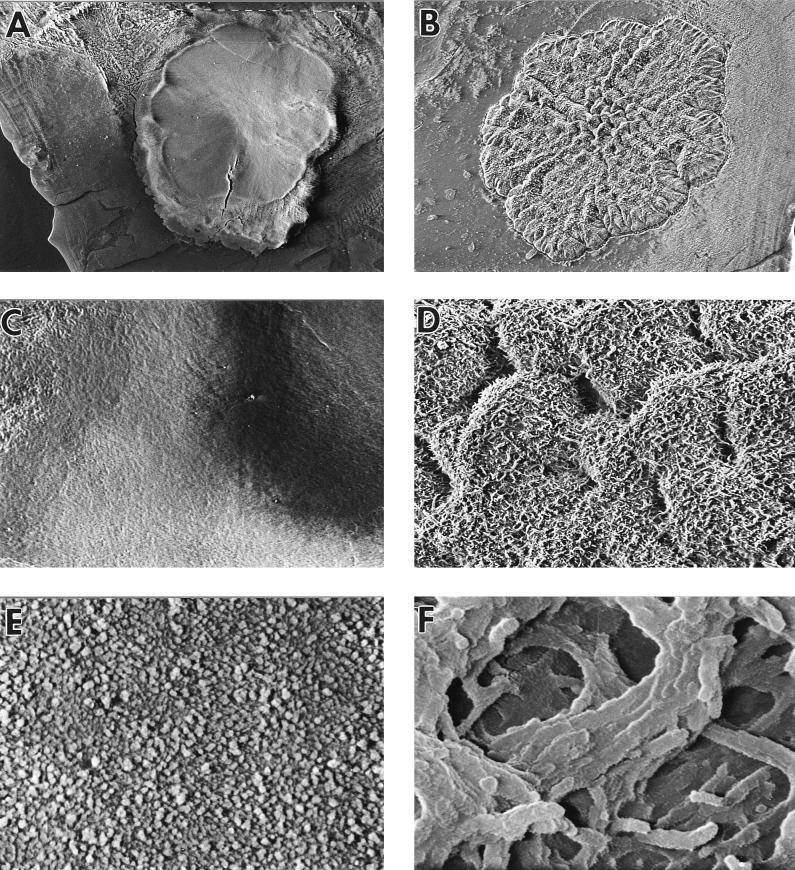
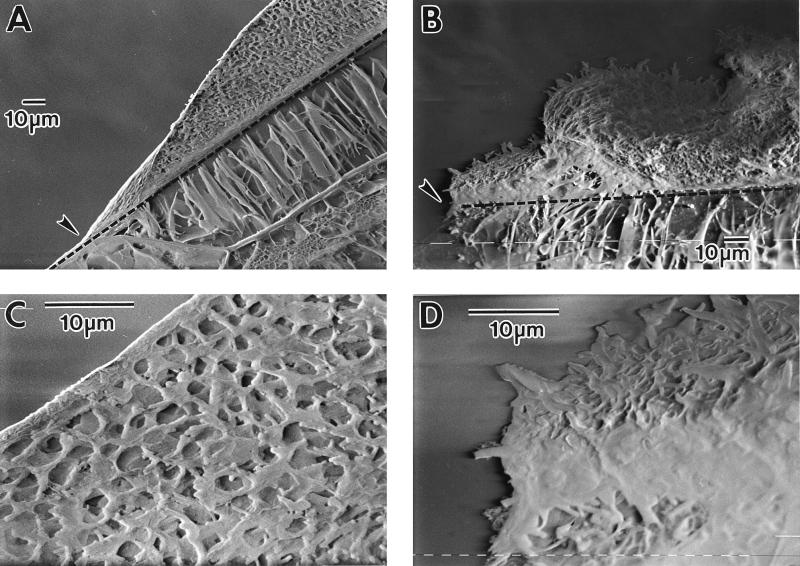
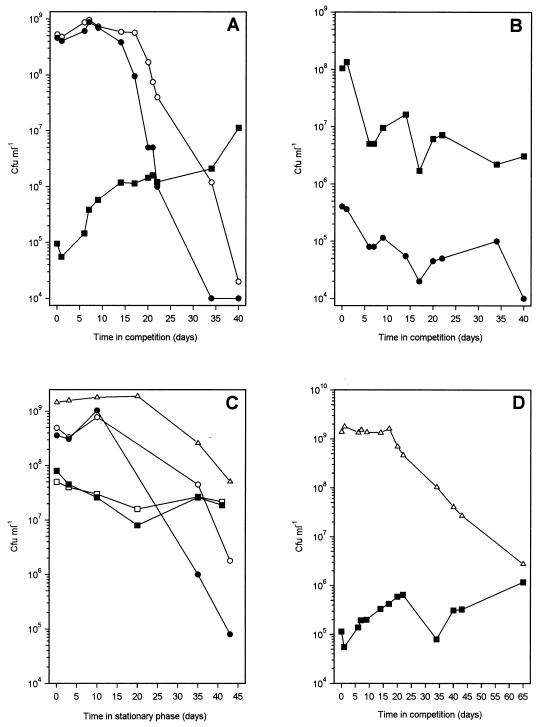
Mycobacterium tuberculosis can persist for many years within host lung tissue without causing clinical disease. Little is known about the state in which the bacilli survive, although it is frequently referred to as dormancy. Some evidence suggests that cells survive in nutrient-deprived stationary phase. Therefore, we are studying stationary-phase survival of Mycobacterium smegmatis as a model for mycobacterial persistence. M. smegmatis cultures could survive 650 days of either carbon, nitrogen, or phosphorus starvation. In carbon-limited medium, cells entered stationary phase before the carbon source (glycerol) had been completely depleted and glycerol uptake from the medium continued during the early stages of stationary phase. These results suggest that the cells are able to sense when the glycerol is approaching limiting concentrations and initiate a shutdown into stationary phase, which involves the uptake of the remaining glycerol from the medium. During early stationary phase, cells underwent reductive cell division and became more resistant to osmotic and acid stress and pool mRNA stabilized. Stationary-phase cells were also more resistant to oxidative stress, but this resistance was induced during late exponential phase in a cell-density-dependent manner. Upon recovery in fresh medium, stationary-phase cultures showed an immediate increase in protein synthesis irrespective of culture age. Colony morphology variants accumulated in stationary-phase cultures. A flat colony variant was seen in 75% of all long-term-stationary-phase cultures and frequently took over the whole population. Cryo scanning electron microscopy showed that the colony organization was different in flat colony strains, flat colonies appearing less well organized than wild-type colonies. Competition experiments with an exponential-phase-adapted wild-type strain showed that the flat strain had a competitive advantage in stationary phase, as well a providing evidence that growth and cell division occur in stationary-phase cultures of M. smegmatis. These results argue against stationary-phase M. smegmatis cultures entering a quiescent state akin to dormancy but support the idea that they are a dynamic population of cells.


Figures

FIG. 1
FIG. 1
Long-term survival of M. smegmatis following nutrient starvation by exhaustion for either carbon (■), nitrogen (•), or phosphorus (▴). Survival was determined by plate counting of viable cells in samples taken from cultures throughout the experiment. Survival during the first 150 days of carbon-limited stationary phase is shown in the inset.
FIG. 2
FIG. 2
Growth of M. smegmatis and entry into carbon-limited stationary phase. (A) Changes in optical density (▵), biomass (dry weight, ▿), and glycerol concentration (○). (B) Changes in viable (■) and total (□) cell numbers and in cell length (▾). The glycerol concentration experiment was performed four times with similar results. OD600, biomass, and viable count results are means ± SE of results of duplicate experiments. Mean cell lengths ± SE are shown, with numbers of cells varying between 12 and 30. Total cell counts are means ± SE of determinations from between 8 and 10 hemocytometer fields of 2.5 × 10⁻⁴ mm3. The vertical dashed lines indicate the point of entry into stationary phase.
FIG. 3
FIG. 3
Effect of changing the initial glycerol concentration in the culture on the glycerol concentration at the point of entry into stationary phase (○). Stationary-phase entry was the point at which the OD600 stabilized (Fig. 2A). Complete experiments were done at least three times for each initial glycerol concentration except for the experiment with 21.3 mM glycerol, which was done only once. At least two glycerol determinations were done for each data point, and values shown are means ± SE. It was experimentally determined that 15.7 mM glycerol was used during exponential growth of the culture, with an initial glycerol concentration of 16.4 mM. For cultures where the amount of glycerol was not limiting (≥16.4 mM), the concentration of glycerol that was expected to be left in the medium upon entry into stationary phase was calculated by subtracting 15.7 from the initial concentration (□).
FIG. 4
FIG. 4
Residual protein synthesis, after inhibition of mRNA synthesis with rifampin, in exponentially growing and stationary-phase cultures. At time zero rifampin (0.1 μg ml−1) was added to the culture, and at various times the protein synthesis was determined by determining the rate of incorporation of [35S]methionine. Rates are given relative to the rate at time zero. ○, exponential-phase culture; •, 20-h-carbon-starved, stationary-phase culture.
FIG. 5
FIG. 5
(A to C) Stress resistance of exponentially growing (■) and 8-h-carbon-starved stationary-phase (□) cultures of M. smegmatis. (A) Acid stress by addition of 1 M HCl to lower the pH to 2; (B) osmotic stress by addition of 5 M NaCl; (C) oxidative stress by addition of 36 mM H2O2. Samples were taken at various times after the application of the specific stress and plated to determine viability. (D to E) Induction of acid, osmotic-, and oxidative-stress resistance (■) during the growth of M. smegmatis measured as OD600 (▵). Samples were taken throughout growth, and viability was determined by plate counting before and after applying a stress condition for fixed periods (indicated on the y axes). Acid (D), osmotic (E), and oxidative (F) stresses were applied as described for panels A to C, respectively. The vertical dashed lines indicate the point of entry into stationary phase. The horizontal dashed line in panel F indicates the OD at which maximal resistance was reached. Experiments were performed at least three times, and the results of a representative experiment are shown. Where values have errors, these are means ± standard deviations of determinations from three plates.
FIG. 6
FIG. 6
Cell-density-dependent induction of oxidative stress resistance in M. smegmatis. Cultures were grown in Hartmans-de Bont minimal medium with different, limiting amounts of glycerol so that they entered stationary phase at different densities. (A) Growth curves of four cultures of M. smegmatis grown in Hartmans-de Bont minimal medium with 1.4 mM (□), 5.5 mM (▾), 11 mM (•), or 27.4 mM glycerol (⋆). (B) Induction of oxidative-stress resistance in the cultures whose growth curves are shown in panel A. Samples were taken throughout growth, and viability was determined before and after exposing the samples to 36 mM H2O2 for 3 h. The horizontal dashed line in panel A indicates the threshold OD600, after which resistance is induced. The vertical dashed line in both graphs indicates the start of stationary phase.
FIG. 7
FIG. 7
Cryo scanning electron micrographs of a wild-type colony (A, C, and E) and a flat colony variant (B, D, and F). (A and B) Colonies viewed from above at a magnification of ×15; (C and D) surfaces of colonies at a magnification of ×120; (E and F) surfaces of colonies at a magnification of ×3,750.
FIG. 8
FIG. 8
Cross-section through a wild-type (A and C) and flat (B and D) colony, viewed by cryo SEM. (A and B) Magnification, ×480. The edge of the colonies is indicated by arrows, and the dashed line shows the division between the agar and the colony. (C and D) Parts of panels A and B at a magnification of ×1,875.
FIG. 9
FIG. 9
Competition experiments. (A) Competition between a minority strain, MSf7-2 (Strr, stationary-phase-adapted flat strain), identified by plating with streptomycin (■), and a majority strain, MS1-1 (Rifr, exponential-phase-adapted, normal-colony-morphology strain), plated with (•) and without (○) rifampin. Five microliters of a 3-day-stationary-phase culture of MSf7-2 was mixed with 5 ml of a 3-day-stationary-phase culture of MS1-1. After 30 days, the number of rifampin-resistant MS1-1 cells dropped to ≤1 × 10⁴. (B) Reverse competition between the MSf7-2 majority strain (■, plated with streptomycin) and the MS1-1 minority strain (•, plated with rifampin). (C) Shown are an MS1-1 control (no MSf7-2 added), plated with (•) and without (○) rifampin; an MSf7-2 control (no MS1-1 added), plated with (■) and without (□) streptomycin; and an MS1 control to the strain used in panel D (no MSf7-2 added), plated without antibiotics (▵). (D) Competition between a minority strain, MSf7-2 (■), and a majority strain, MS1 (▵). All competitions were performed three times with similar results. Plating errors were within 10% of the viable counts. Note that although the proportion of the majority cells to minority cells inoculated was always 1,000:1 (vol/vol), there appeared to be 10,000-fold more MS1-1 cells than MSf7-2 cells in Fig. 8A, compared with only 500-fold more MSf7-2 cells in Fig. 8B. This was due to the fact that flat cultures clumped more, which reduced the viable counts of flat strains approximately 10-fold compared with counts for the wild type under similar conditions.

References

    1. Albertson N H, Nystrom T, Kjelleberg S. Functional mRNA half-lives in the marine Vibrio sp. S14 during starvation and recovery. J Gen Microbiol. 1990;136:2195–2199.
    1. Albertson N H, Nystrom T, Kjelleberg S. Macromolecular synthesis during recovery of the marine Vibrio sp. S14 from starvation. J Gen Microbiol. 1990;136:2201–2207.
    1. Amy P S, Pauling C, Morita R Y. Recovery from nutrient starvation by a marine Vibrio sp. Appl Environ Microbiol. 1983;45:1685–1690. - PMC - PubMed
    1. Barer M R. Viable but non-culturable and dormant bacteria: time to resolve an oxymoron and a misnomer? J Med Microbiol. 1997;46:629–631. - PubMed
    1. Belisle J T, Brennan P J. Chemical basis of rough and smooth variation in mycobacteria. J Bacteriol. 1989;171:3465–3470. - PMC - PubMed

Publication types

LinkOut - more resources