. 1998 Dec 28;143(7):2009-22.
doi: 10.1083/jcb.143.7.2009.

Desmoplakin is required early in development for assembly of desmosomes and cytoskeletal linkage

Affiliations

Desmoplakin is required early in development for assembly of desmosomes and cytoskeletal linkage

G I Gallicano et al. J Cell Biol. .

Abstract

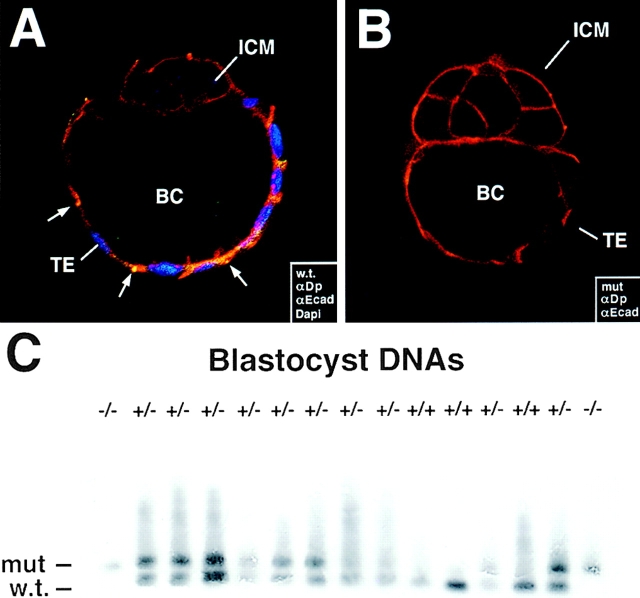
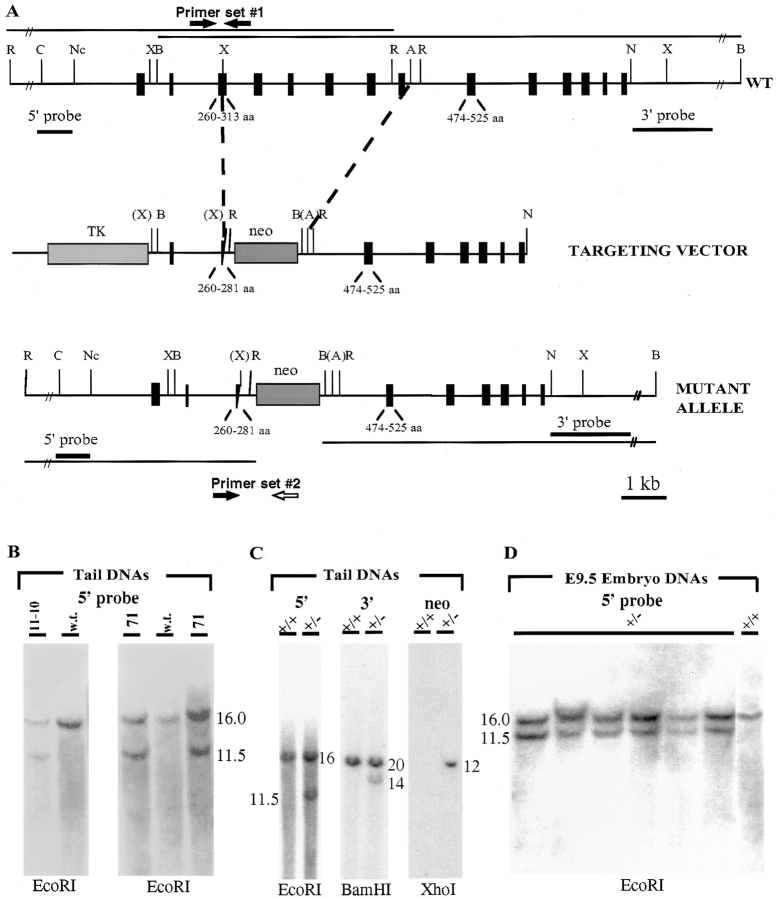
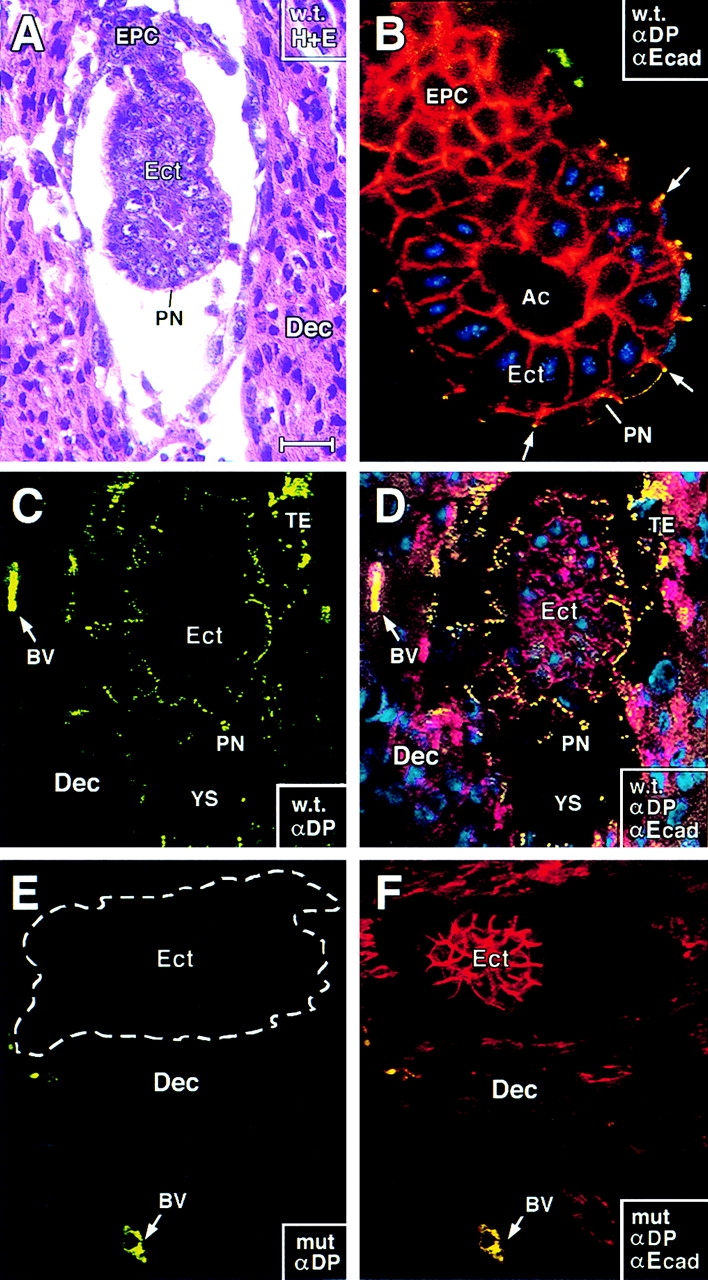
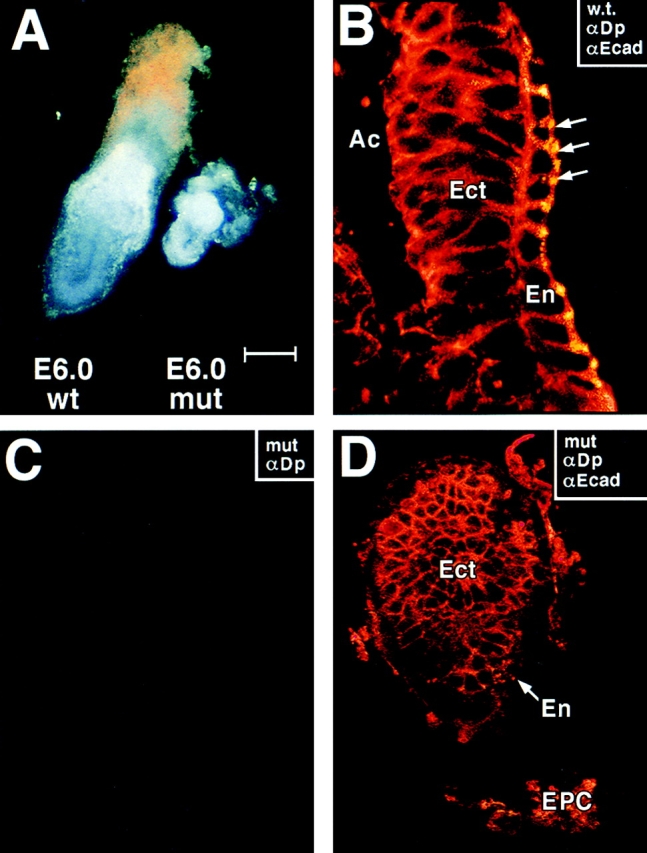
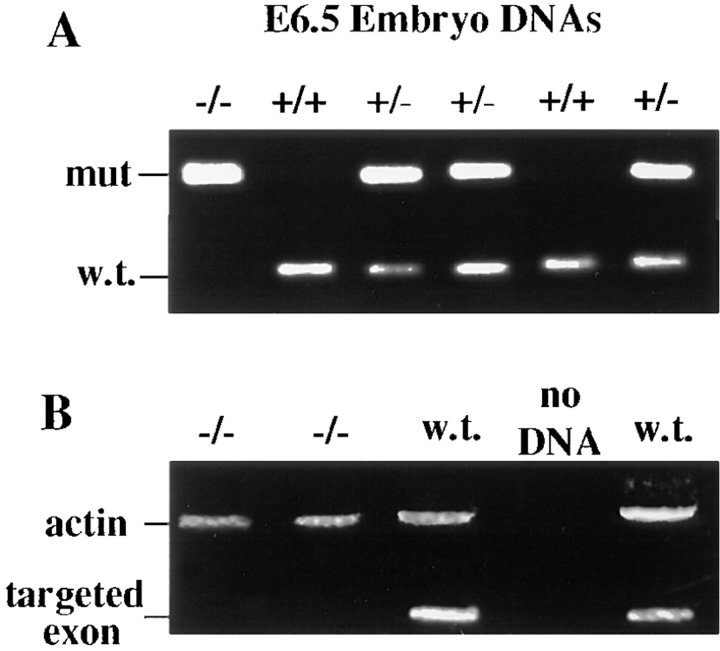
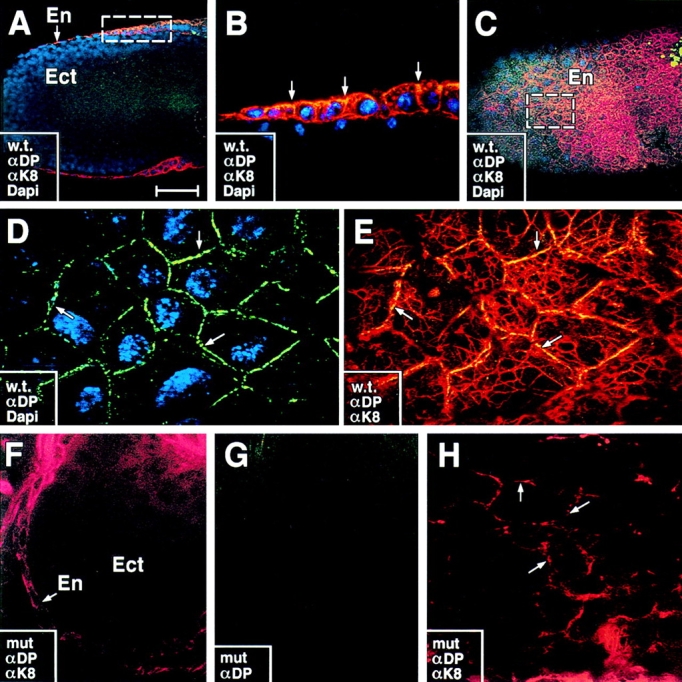
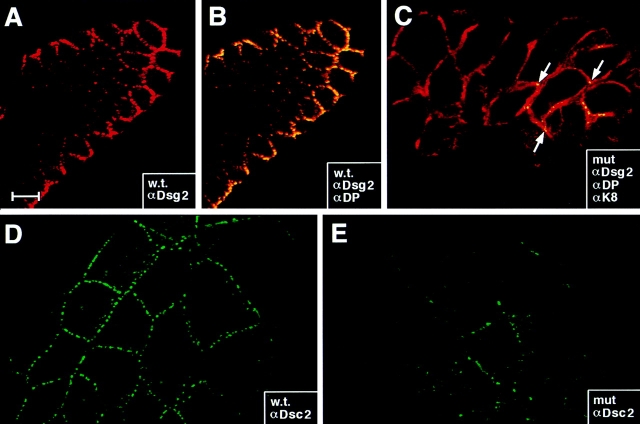
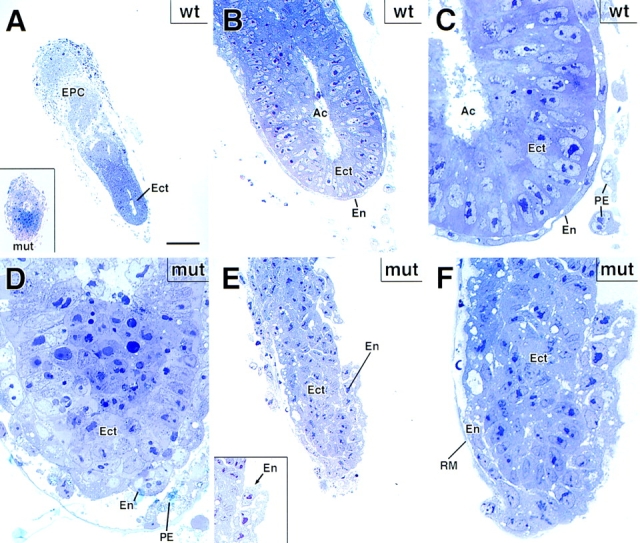
Desmosomes first assemble in the E3.5 mouse trophectoderm, concomitant with establishment of epithelial polarity and appearance of a blastocoel cavity. Throughout development, they increase in size and number and are especially abundant in epidermis and heart muscle. Desmosomes mediate cell-cell adhesion through desmosomal cadherins, which differ from classical cadherins in their attachments to intermediate filaments (IFs), rather than actin filaments. Of the proteins implicated in making this IF connection, only desmoplakin (DP) is both exclusive to and ubiquitous among desmosomes. To explore its function and importance to tissue integrity, we ablated the desmoplakin gene. Homozygous -/- mutant embryos proceeded through implantation, but did not survive beyond E6.5. Surprisingly, analysis of these embryos revealed a critical role for desmoplakin not only in anchoring IFs to desmosomes, but also in desmosome assembly and/or stabilization. This finding not only unveiled a new function for desmoplakin, but also provided the first opportunity to explore desmosome function during embryogenesis. While a blastocoel cavity formed and epithelial cell polarity was at least partially established in the DP (-/-) embryos, the paucity of desmosomal cell-cell junctions severely affected the modeling of tissue architecture and shaping of the early embryo.


Figures

Figure 2
Figure 2
Absence of desmoplakin in a portion of E3.5 blastocysts that still undergo blastocoel cavity formation. DP (+/−) heterozygous matings were conducted, and embryos at E3.5 were removed before implantation from pregnant females. (A and B) Blastocysts were analyzed by indirect immunofluorescence using the antibodies indicated in the boxes, and embryos were visualized by whole mount confocal microscopy. Anti-desmoplakin (αDP, green), anti-E-cadherin (αEcad, red), and DAPI (DNA, blue); ICM, inner cell mass; TE, trophectoderm; BC, blastocoel cavity. Note yellow dots, reflective of αDP/αEcad double-labeling, in endoderm of wt (w.t.), but not mutant (mut) trophectoderm (A, arrow). (C) DNAs were isolated from blastocysts, and genotyping was done by PCR and Southern blot analysis (necessary due to the small size of the embryos). Two different primer sets were used to delineate between wild type and targeted allele (see Fig. 1 A). Primer set no. 1 amplified a 215-bp fragment of the wt allele (w.t.) while primer set no. 2 amplified a 300-bp fragment in the targeted allele (mut). After resolution by agarose gel electrophoresis, bands were transferred to Hybond paper, which was then hybridized with a ECL-labeled probe specific for the sequences present in both mutant and wt alleles. Note that the embryo DNA in first and last lanes scored negative for the wt allele. Shown are data from mouse line 11-10. 1 cm = 20 μm.
Figure 1
Figure 1
Targeting of the desmoplakin allele. (A) Stick diagrams illustrate restriction map of mDP1 genomic locus (WT), targeting vector used, and resulting genomic locus following successful homologous recombination with targeted construct (mutant allele). A 4.5-kb XhoI-AvrII fragment beginning at aa 281 (843 bp downstream from the ATG translation start codon) and ending in an intron 3′ from encoded aa 473 (1,419 bp downstream of the ATG) was targeted for removal and replaced with the pgk1-neomycin resistance gene (neo). The pgk1-Herpes thymidine kinase gene (TK) was inserted 5′ for negative selection. 5′ and 3′ probes used for Southern blot analyses are shown in bold; thin lines correspond to the predicted sizes of the restriction fragments that will hybridize to these probes. C, Cla 1; Nc, Nco 1; B, Bam H1; N, Nhe 1; R, EcoRI; X, XhoI; A, AvrII. Primer sets correspond to those used in PCR analysis for identifying the mutant and wt alleles. (B–D) Southern blot analysis. Restriction endonucleases used for digestions are indicated beneath each blot; sizes of hybridizing bands are indicated in kb. (B) Tail DNAs were from brown mice that were candidates for germline transmission of the targeted allele. These mice were derived from ES clones 11-10 and 71. (C) Tail DNAs from an established mouse line of 11-10, showing 5′ and 3′ analysis as well as verification that the recombination was a single event. Note: Both ES clones went germline; however our study focuses on clone 11-10, since clone 71 showed inappropriate recombination at the 3′ end of the locus, even though 5′ recombination and deletion of the 4.5-kb DP sequence was successful (data not shown). (D) E9.5 DNAs from heterozygous (+/−) matings. Only those embryos that scored positive in a PCR prescreen were subjected to Southern analysis. As shown, all of these were genotypically heterozygous (wt at right was a control). This was true for all matings >E6.5.
Figure 3
Figure 3
E5.0 DP mutant embryos form and appear similar in size and in anti-E-cadherin staining to wt embryos. E5.0 embryos were either dissected from their decidua and processed for whole mount immunofluorescence (B) or left intact and subjected to sectioning and either histology (hematoxylin and eosin staining; A) or immunofluorescence (C–F). Antibodies used for immunofluorescence are: anti-desmoplakin (αDP, green), anti-E-cadherin (αEcad, red), and DAPI (DNA, blue). Corner boxes denote wt (w.t.) or DP null (mut) and also where relevant, which of the immunofluorescence images are captured in each frame. All frames shown are of longitudinal views through the central region of the embryos. Ect, primitive ectoderm; PN, primitive endoderm; EPC, ectoplacental cone; TE, giant trophectoderm cells (visible only in undissected embryos); BV, maternally derived blood vessels in decidua; Ac, proamniotic cavity; YS, yolk sac. Note yellow dots in PN, EPC, and TE of wt embryos and in maternal BV of wt or mutant embryos, indicative of double-labeling with αDP and αEcad. Note: At E5.0, mutant and wt embryos are still similar in size; the section shown in E and F was slightly off center, giving it a smaller appearance than in C and D. Bar, (A, E, and F) 75 μm; (B) 20 μm; (C and D) 50 μm.
Figure 4
Figure 4
E6.0 mutant embryos that lack desmoplakin are abnormally small. DP (+/−) heterozygous matings were conducted, and E6.0 embryos were removed from pregnant females and dissected from their decidua. Embryos were either photographed directly (A) or analyzed by indirect immunofluorescence using the antibodies indicated in the boxes (all other panels). Immunofluorescence was visualized by whole mount confocal microscopy. Approximately 25% of the embryos were small for their age and these were negative for αDP staining. Anti-desmoplakin (αDP, green), anti-E-cadherin (αEcad, red), and DAPI (DNA, blue); Ac, proamniotic cavity; Ect, embryonic ectoderm; En, visceral endoderm; Epc, ectoplacental cone. Note yellow dots, reflective of αDP/αEcad double-labeling, in endoderm of wt (w.t.) E6.0 embryo (B, arrows). Bar, (A) 125 μm; (B) 25 μm; (C and D) 50 μm.
Figure 5
Figure 5
Identification of desmoplakin null embryos from E6.5 heterozygous matings. E6.5 embryos of heterozygous DP matings were dissected from their decidua, and their DNAs were isolated, and subjected to PCR analysis. (A) Two different primer sets were used to delineate between wt and targeted allele, as described in the legend to Fig. 2. Note that the embryo DNA in the left-most lane scored negative for the wt allele. Shown are data from mouse line 11-10. (B) To verify that the 4.5-kb fragment targeted for removal was missing from the genome of (−/−) E6.5 embryos, primer set no. 3 was engineered from sequences only contained within the targeted fragment. Production of a 150-bp fragment (targeted exon) was indicative for the presence of a wt allele. A 500-bp actin fragment was amplified as a control in this experiment. Shown are data from mouse line 71.
Figure 6
Figure 6
The keratin network is perturbed in DP mutant embryos. E6.0 embryos were taken from DP (+/−) heterozygous matings, dissected from their decidua and analyzed by whole mount indirect immunofluorescence microscopy using the antibodies indicated in the boxes. Embryos were visualized by confocal microscopy. Shown are either photographs of the embryo surface (C–E, G, and H) or cross sections (A, B, and F). αK8, TROMA-1, a K8-specific antibody (red); anti-desmoplakin (αDP, green), DAPI (DNA, blue). Wt embryos are shown in A–E; mutant embryos from the same litter are shown in F–H. En, visceral endoderm; Ect, embryonic ectoderm. Note: In wt embryos, αDP and αK8 staining is visible at intercellular borders and throughout the cytoplasm of En cells, but not Ect cells. Labeling at intercellular borders is best visualized in cross sections; arrows in B denote double-labeling (yellow) at junction sites where αDP also stains. Boxes in A and C denote areas that are presented at higher magnification in B and D, respectively. Labeling of intracellular keratin network is best visualized in surface views (e.g., E and H). Many keratin bundles were seen in close contact with DP positive sites at cell–cell borders (D and E, arrows). Surface area of mutant embryo in F and G is identical. Note absence of αDP staining and disorganization of keratin filament bundles in F–H. Arrows in H denote concentration of anti-K8 staining at cell borders; cytoplasmic staining was either collapsed (cells in lower right in H) or absent. Bar: (A and C) 75 μm; (B) 25 μm; (D and E) 10 μm; (F and G) 50 μm; (H) 10 μm.
Figure 7
Figure 7
Reduction but not absence of anti-desmosomal cadherin staining in E6.0 DP mutant embryos. E6.0 embryos were taken from DP (+/−) heterozygous matings, dissected from their decidua and analyzed by whole mount indirect immunofluorescence microscopy using the antibodies indicated in the boxes. Embryos were visualized by confocal microscopy. Shown in A and B are sectional views, with the embryonic ectoderm in the center and endoderm at the surface. C–G are surface views, showing only the endodermal cells, positive for desmoplakin in the wt. Antibodies are: (A and B) anti-desmoglein 2 (αDsg2, red) ±anti-desmoplakin (αDP, green); (C) αDsg2 (green), αDP (blue, absent), αK8 (red); (D and E) anti-desmocollin2 (Dsc2, green). Note: αDsg2 and αDsc2 did not label the embryonic ectoderm, consistent with the similar restricted residence of desmoplakin and keratin. Embryos were identified as mutant (mut) or wt (w.t.) based upon αDP labeling, which when absent was accompanied by perturbations in the K8/K18 network. Arrows in C denote presence of a few punctate dots of αDsg2 staining in the mutant embryo. Bar: (A and B) 30 μm; (C–E) 20 μm.
Figure 8
Figure 8
Mutant DP embryos are defective in egg cylinder elongation. Wt and mutant E6 embryos were processed for semithin sectioning, toluidine blue staining and microscopy. Shown are: (A–C) representative example of a wt E6 embryo, depicting a single layer of flattened visceral endoderm cells (En) encasing a single layer of columnar embryonic ectoderm (Ect). Inset to A shows an example of a small mutant E6 embryo, which was quite typical and accounted for ∼75% of the mutant DP E6 embryos within heterozygous matings. Ac, proamniotic cavity; EPC, ectoplacental cone; RM, Reichert's membrane; PE, parietal endoderm. D shows higher magnification of the mutant embryo in inset to A, revealing a very small proamniotic cavity (light blue area at top center of panel). E, E inset, and F provide example of a larger mutant DP embryo, which was still markedly smaller than its wt counterparts, but which did show some signs of egg cylinder formation, albeit aberrant. Note defects in cell–cell adhesion within the embryonic endoderm. These larger embryos most likely had additional secondary defects, and thus were not used for most analyses. Bar: (A and inset) 100 μm; (B and E inset) 35 μm; (C, D, and F) 20 μm; (E) 50 μm.
Figure 9
Figure 9
Mutant DP embryos display a dramatic reduction in desmosomes with loss of keratin filament attachment, but with no major changes in adherens or tight junctions. Wt and mutant E6.0 embryos, and newborn backskin epidermis from a wt embryo, were dissected from their decidua and processed for conventional electron microscopy or for immunoelectron microscopy using αPg antibodies. Shown are examples of cell–cell junctions present in the three cell types of the embryo. Note: No desmosomes were detected in wt or mutant embryonic ectoderm, consistent with immunofluorescence data. (from A to B) E6.0 wt ectoplacental cone, depicting desmosomes (de), with keratin filaments (kf) attached, and adherens junctions (aj); (C) desmosome in first suprabasal layer of newborn epidermis; these junctions were many fold more numerous in epidermis than in E6.0 embryos. (D and D′) Desmosomes from wt embryonic endoderm. (E and E′′) desmosomes in mutant embryonic endoderm (E and E′) and ectoplacental cone (E′′). Note: these examples were rare, particularly the one in E′′. Overall very few discernible desmosomes were observed. (F and G) Adherens junctions (aj) and tight junctions (tj) from DP mutant endoderm cells (F) and EPC (G). Note: Despite the paucity of desmosomes in these cells, these junctions appeared normal. (H and I) Immunoelectron microscopy of wt and mutant ectoplacental cone tissue, respectively, labeled with αPg antibodies. Mi, mitochondria; mv, microvilli at the embryo surface; gj, gap junction. Bars: (A–I) 100 nm.

References

    1. Adams CL, Nelson WJ, Smith SJ. Quantitative analysis of cadherin-catenin-actin reorganization during development of cell–cell adhesion. J Cell Biol. 1996;135:1899–1911. - PMC - PubMed
    1. Allen E, Yu QC, Fuchs E. Mice expressing a mutant desmosomal cadherin exhibit abnormalities in desmosomes, proliferation, and epidermal differentiation. J Cell Biol. 1996;133:1367–1382. - PMC - PubMed
    1. Andra K, Lassmann H, Bittner R, Shorny S, Fassler R, Propst F, Wiche G. Targeted inactivation of plectin reveals essential function in maintaining the integrity of skin, muscle, and heart cytoarchitecture. Genes Dev. 1997;11:3143–3156. - PMC - PubMed
    1. Andra K, Nikolic B, Stocher M, Drenckhahn D, Wiche G. Not just scaffolding: plectin regulates actin dynamics in cultured cells. Genes Dev. 1998;12:3442–3451. - PMC - PubMed
    1. Angres B, Barth A, Nelson WJ. Mechanism for transition from initial to stable cell–cell adhesion: kinetic analysis of E-cadherin-mediated adhesion using a quantitative adhesion assay. J Cell Biol. 1996;134:549–557. - PMC - PubMed

Publication types