

Low-frequency modulation sensors using nanosecond fluorophores
- PMID: 9868909
- PMCID: PMC6938645
- DOI: 10.1021/ac980876c
Low-frequency modulation sensors using nanosecond fluorophores
Abstract
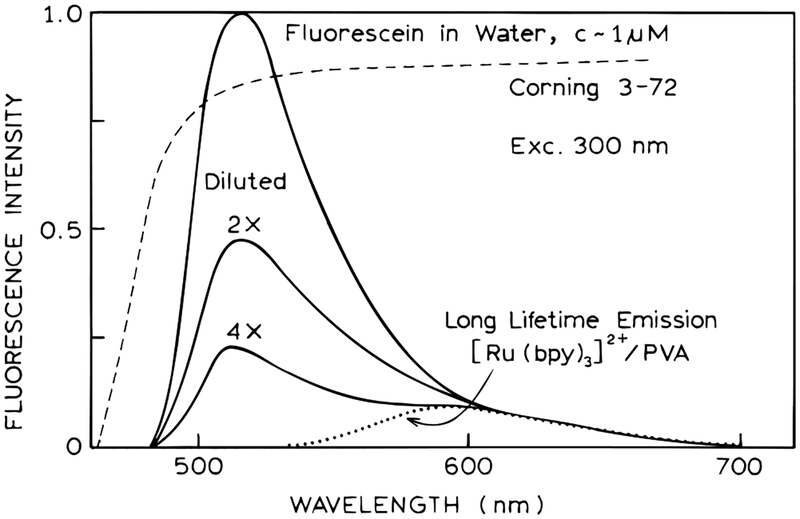
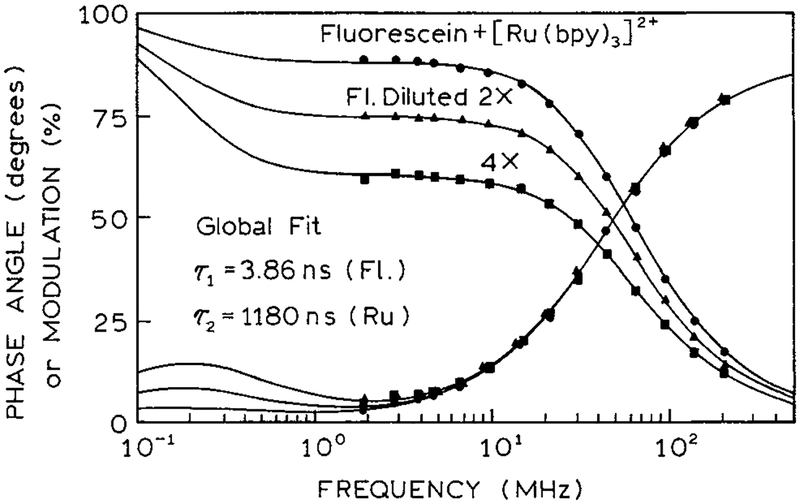
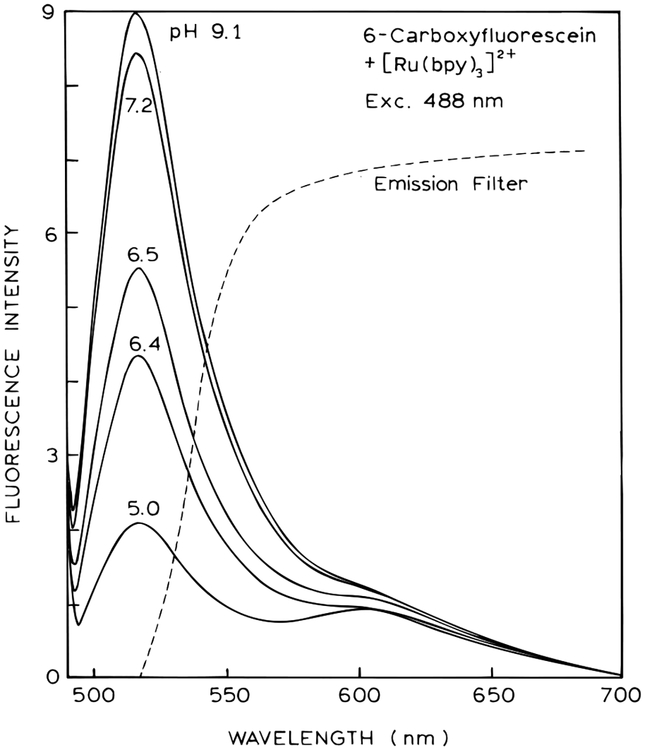
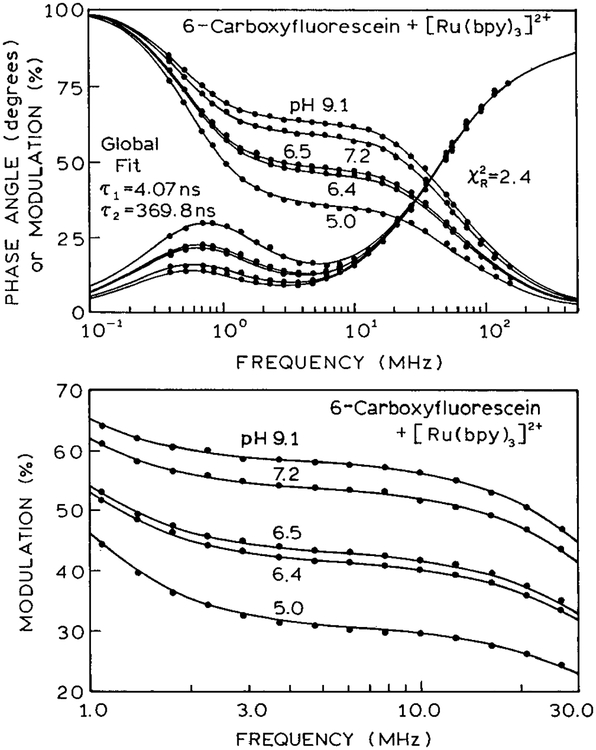
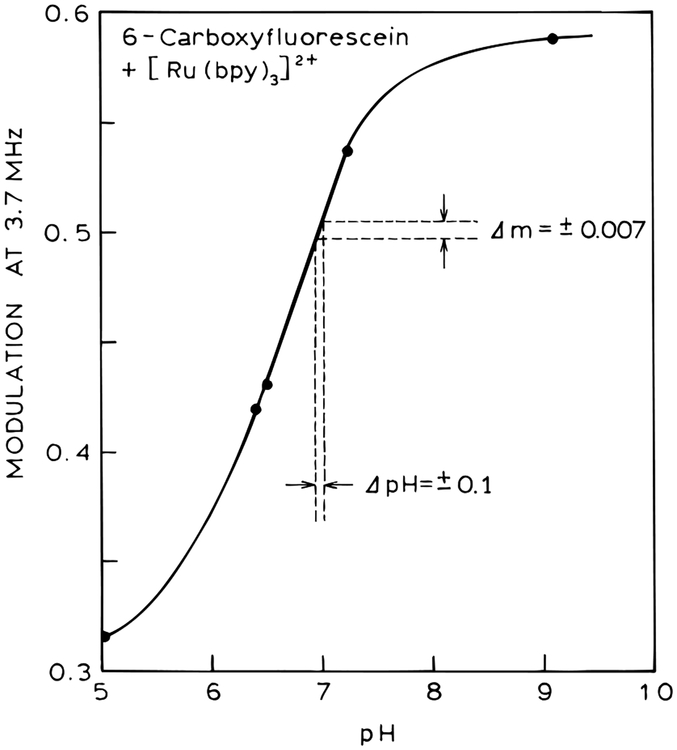
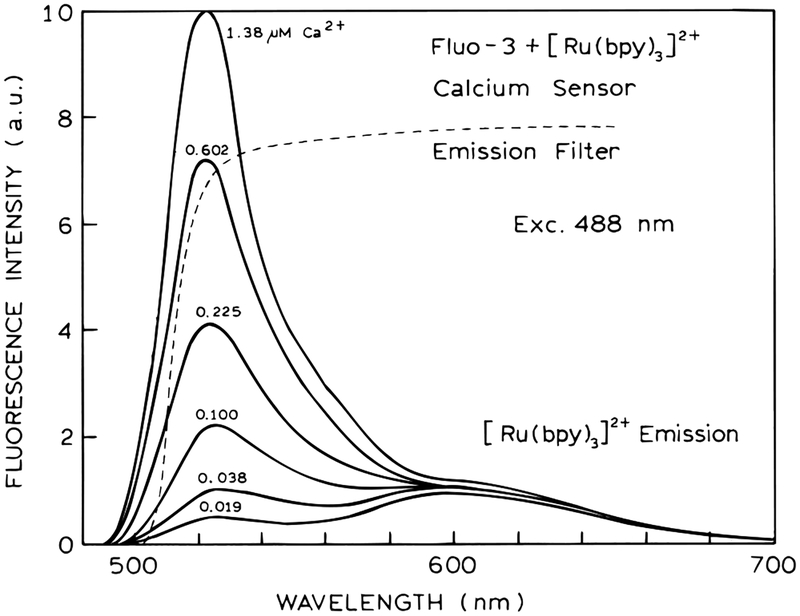
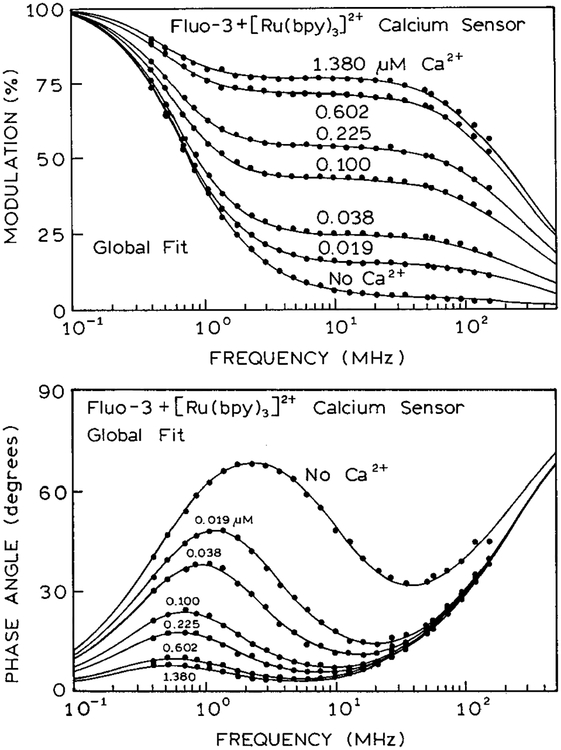
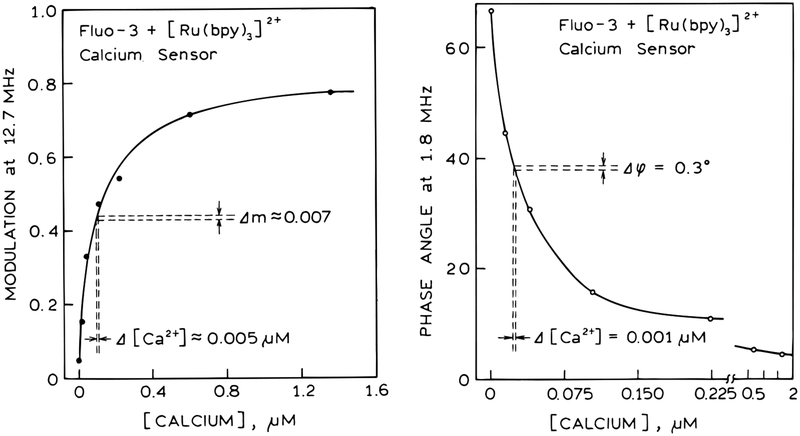
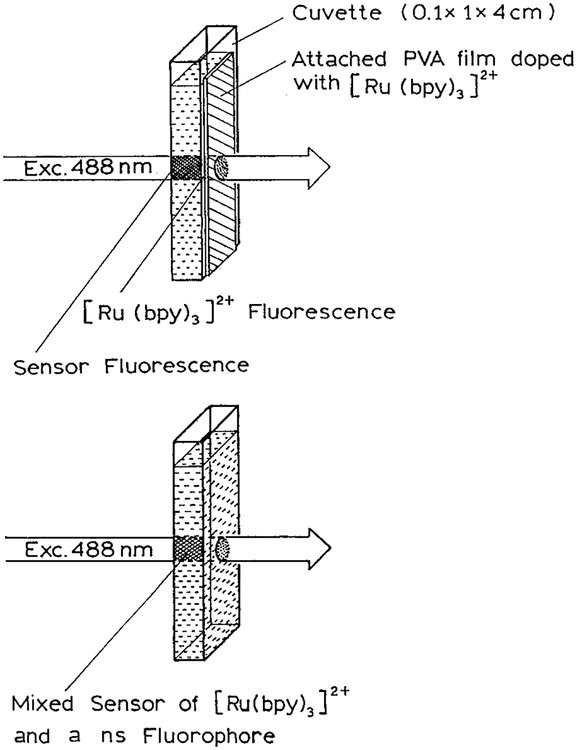
We describe a new approach to fluorescence sensing based on a mixture of fluorophores, one of which is sensitive to the desired analyte. If a long-lifetime analyte-insensitive fluorophore is mixed with a short-lifetime analyte-sensitive fluorophore, the modulation of the emission at conveniently low frequencies becomes equal to the fractional fluorescence intensity of the sensing fluorophore. Under these conditions, the modulation can be used to determine the analyte concentration. This can be used with any fluorophore that changes intensity in response to analyte and does not require the sensing fluorophore to display a change in lifetime. The feasibility of modulation-based sensing was demonstrated using mixtures of 6-carboxyfluorescein and [Ru 2,2'-(bipyridyl)3]2+ as a pH sensor and of the calcium probe Fluo-3 and [Ru 2,2'-(bipyridyl)3]2+ as a calcium sensor.
Figures
Similar articles
-
Long-lifetime metal-ligand pH probe.Anal Biochem. 1997 May 1;247(2):216-22. doi: 10.1006/abio.1997.2057. Anal Biochem. 1997. PMID: 9177680 Free PMC article.
-
Real-time background suppression during frequency domain lifetime measurements.Anal Biochem. 2002 Oct 1;309(1):19-26. doi: 10.1016/s0003-2697(02)00213-0. Anal Biochem. 2002. PMID: 12381357 Free PMC article.
-
Fiber optic lifetime pH sensing based on ruthenium(II) complexes with dicarboxybipyridine.Anal Chim Acta. 2008 Sep 19;626(1):62-70. doi: 10.1016/j.aca.2008.07.044. Epub 2008 Aug 6. Anal Chim Acta. 2008. PMID: 18761122
-
[Development of a novel enzyme-redox-mediator system based on a fungal laccase and ruthenium complexes].Prikl Biokhim Mikrobiol. 2006 Nov-Dec;42(6):629-37. Prikl Biokhim Mikrobiol. 2006. PMID: 17168291 Russian.
-
Potential applications of lifetime-based, phase-modulation fluorimetry in bioprocess and clinical monitoring.Trends Biotechnol. 1995 Mar;13(3):106-15. doi: 10.1016/S0167-7799(00)88915-5. Trends Biotechnol. 1995. PMID: 7766217 Free PMC article. Review.
Cited by
-
Synthesis and photophysical and electrochemical properties of functionalized mono-, bis-, and trisanthracenyl bridged Ru(II) bis(2,2':6',2"-terpyridine) charge transfer complexes.ScientificWorldJournal. 2014;2014:570864. doi: 10.1155/2014/570864. Epub 2014 Apr 30. ScientificWorldJournal. 2014. PMID: 24883408 Free PMC article.
-
Fluorescence properties of rhodamine 800 in whole blood and plasma.Anal Biochem. 2000 Mar 15;279(2):142-50. doi: 10.1006/abio.2000.4486. Anal Biochem. 2000. PMID: 10706783 Free PMC article.
-
A protein biosensor for lactate.Anal Biochem. 2000 Jul 15;283(1):83-8. doi: 10.1006/abio.2000.4611. Anal Biochem. 2000. PMID: 10929812 Free PMC article.
-
Glucose sensor for low-cost lifetime-based sensing using a genetically engineered protein.Anal Biochem. 1999 Feb 1;267(1):114-20. doi: 10.1006/abio.1998.2974. Anal Biochem. 1999. PMID: 9918662 Free PMC article.
-
On the Possibility of Glucose Sensing Using Boronic Acid and a Luminescent Ruthenium Metal-Ligand Complex.J Fluoresc. 2002 Jun;12(2):187-192. doi: 10.1023/A:1016800515030. J Fluoresc. 2002. PMID: 32377061 Free PMC article.
References
-
- Schulman SG, Ed. Molecular Luminescence Spectroscopy, Methods and Applications: Part 3; John Wiley & Sons: New York, 1993; p 467.
-
- Spichiger-Keller UE Chemical Sensors and Biosensors for Medical and Biological Applications; Wiley-VCH: New York, 1998; p 413.
-
- Wolfbeis OS, Ed. Fiber Optic Chemical Sensors and Biosensors; CRC Press: Boca Raton, FL, 1991; Vol. I, p 413.
-
- Wolfbeis OS, Ed. Fiber Optic Chemical Sensors and Biosensors; CRC Press: Boca Raton, FL, 1991; Vol. II, p 358.
-
- Kunz RE, Ed. Part I: Plenary and Parallel Sessions; Part II: Poster Sessions, Proc. of 3rd European Conference on Optical Chemical Sensors and Biosensors, Europt(R)odeIII. Elsevier Publishers: New York, 1996. (Sens. Actuators B 1996, 38, 1–188).
Publication types
MeSH terms
Substances
Grants and funding
LinkOut - more resources
Full Text Sources
Other Literature Sources
