Comparative Study
. 1999 Jan 1;19(1):381-90.
doi: 10.1523/JNEUROSCI.19-01-00381.1999.

Relationship between afferent and central temporal patterns in the locust olfactory system

Affiliations
Comparative Study

Relationship between afferent and central temporal patterns in the locust olfactory system

M Wehr et al. J Neurosci. .

Abstract

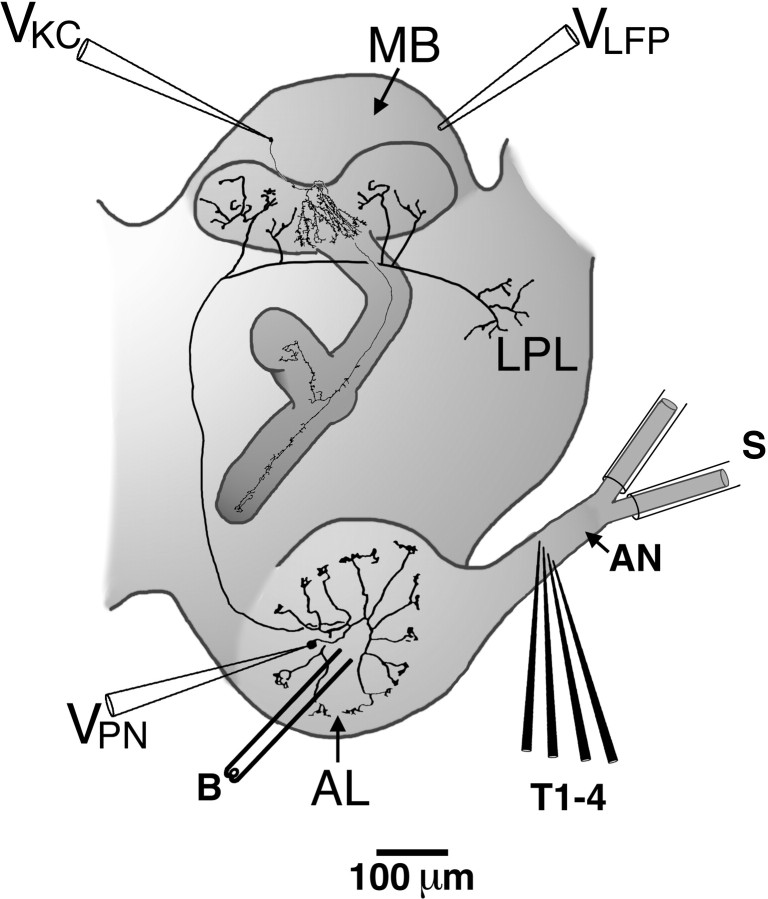
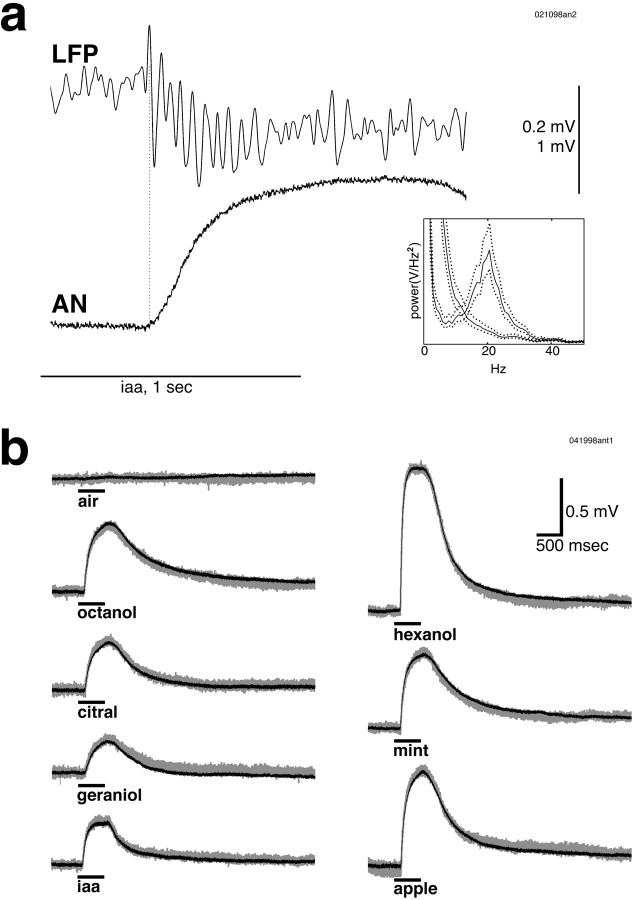
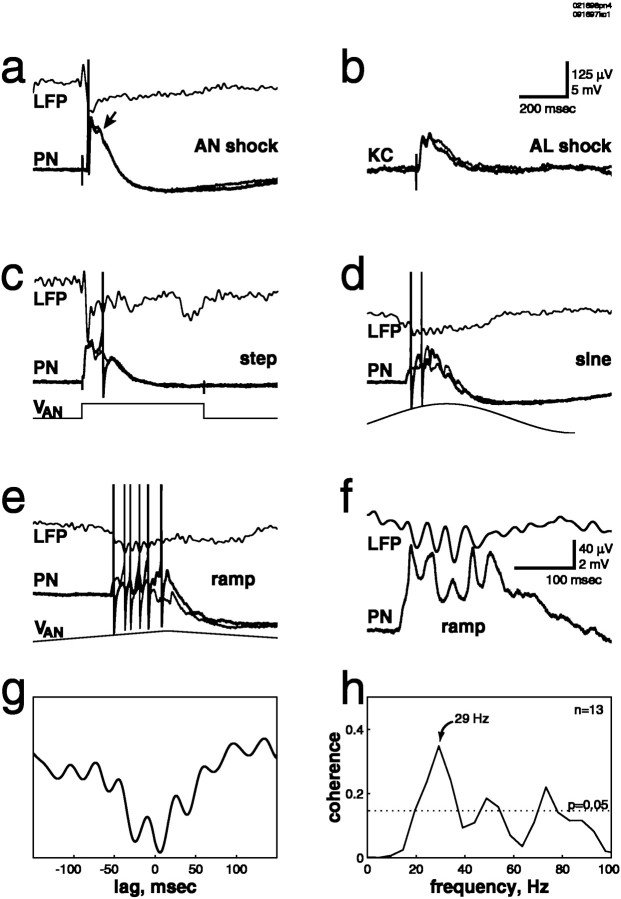
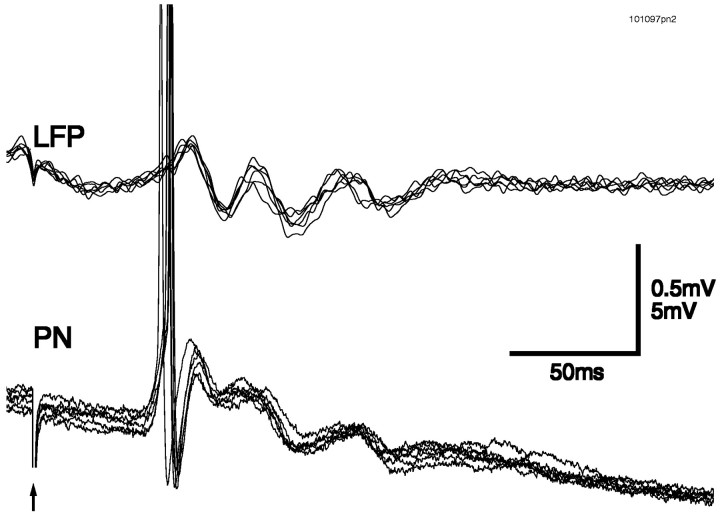
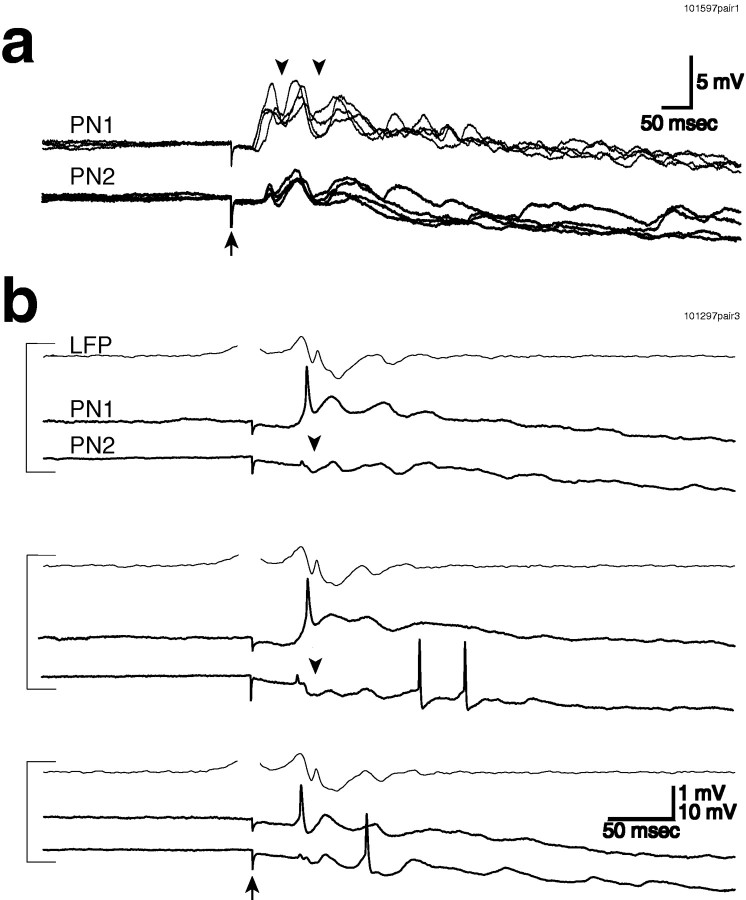
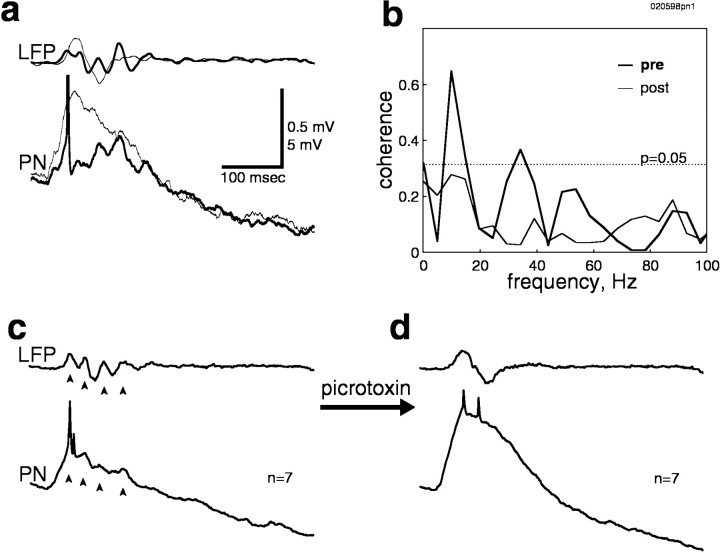
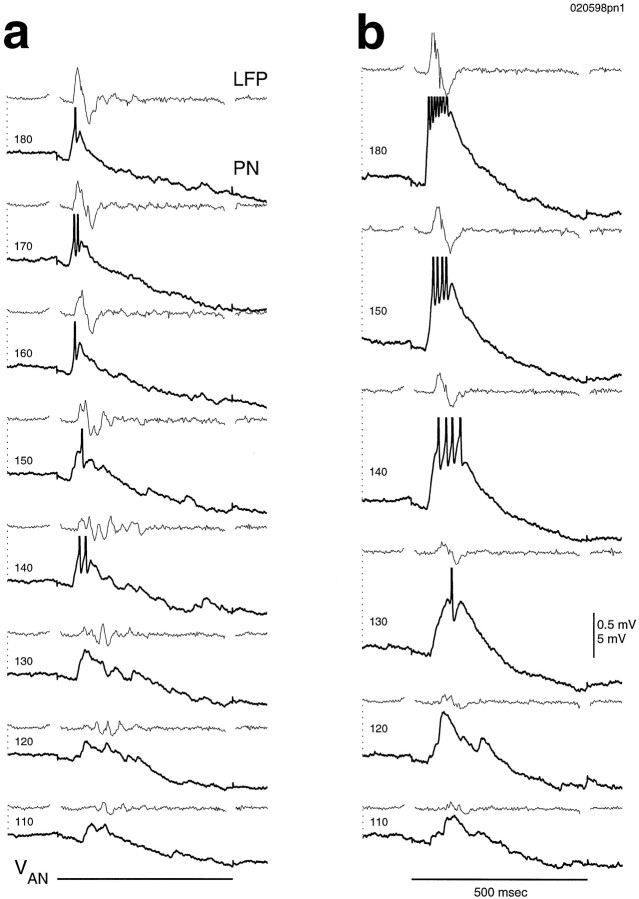
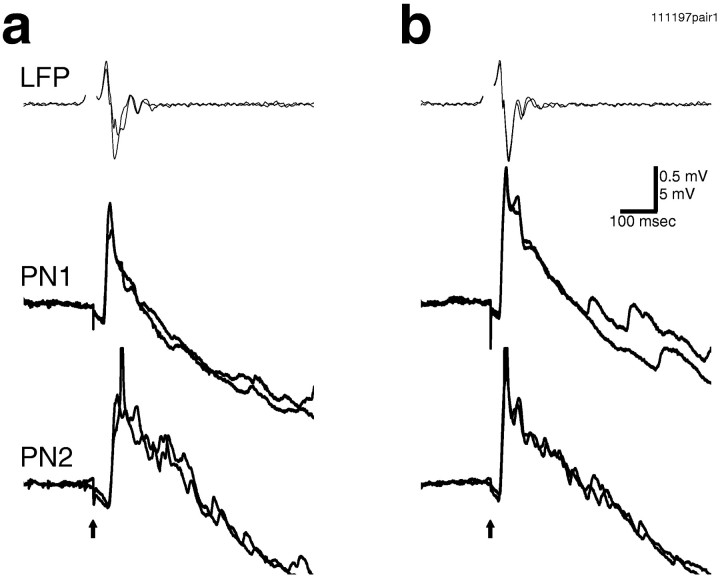
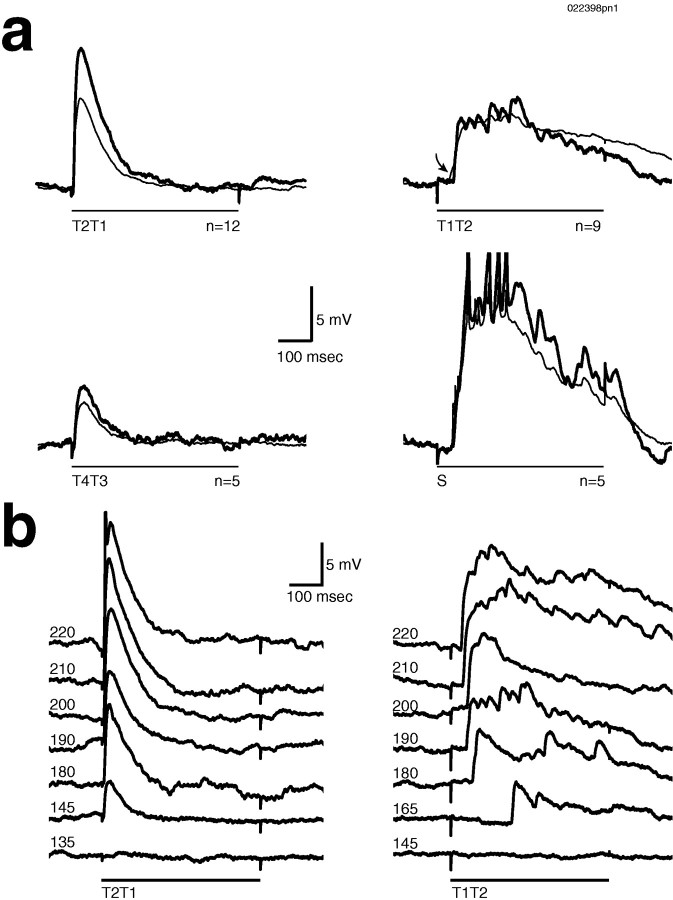
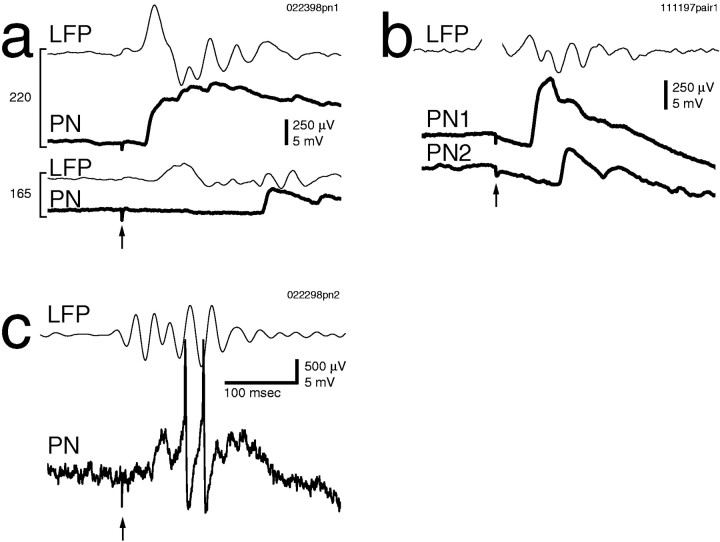
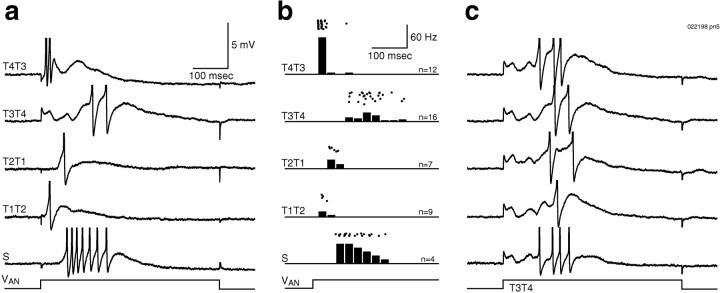
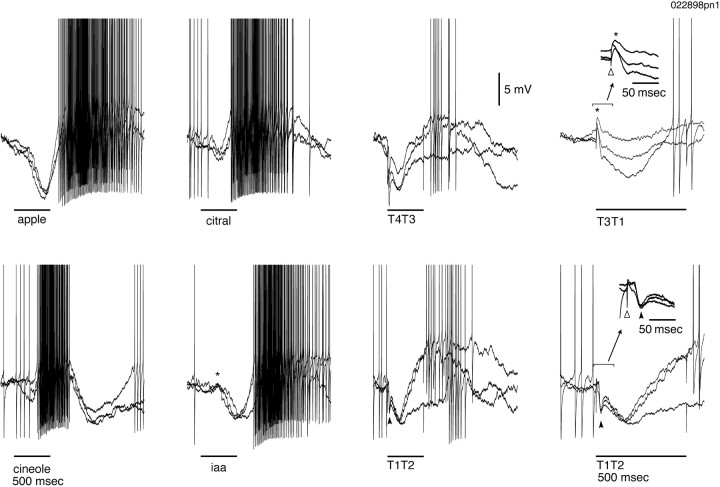
Odors evoke synchronized oscillations and slow temporal patterns in antennal lobe neurons and fast oscillations in the mushroom body local field potential (LFP) of the locust. What is the contribution of primary afferents in the generation of these dynamics? We addressed this question in two ways. First, we recorded odor-evoked afferent activity in both isolated antennae and intact preparations. Odor-evoked population activity in the antenna and the antennal nerve consisted of a slow potential deflection, similar for many odors. This deflection contained neither oscillatory nor odor-specific slow temporal patterns, whereas simultaneously recorded mushroom body LFPs exhibited clear 20-30 Hz oscillations. This suggests that the temporal patterning of antennal lobe and mushroom body neurons is generated downstream of the olfactory receptor axons. Second, we electrically stimulated arrays of primary afferents in vivo. A brief shock to the antennal nerve produced compound PSPs in antennal lobe projection neurons, with two peaks at an approximately 50 msec interval. Prolonged afferent stimulation with step, ramp, or slow sine-shaped voltage waveforms evoked sustained 20-30 Hz oscillations in projection neuron membrane potential and in the mushroom body LFP. Projection neuron and mushroom body oscillations were phase-locked and reliable across trials. Synchronization of projection neurons was seen directly in paired intracellular recordings. Pressure injection of picrotoxin into the antennal lobe eliminated the oscillations evoked by electrical stimulation. Different projection neurons could express different temporal patterns in response to the same electrical stimulus, as seen for odor-evoked responses. Conversely, individual projection neurons could express different temporal patterns of activity in response to step stimulation of different spatial arrays of olfactory afferents. These patterns were reliable and remained distinct across different stimulus intensities. We conclude that oscillatory synchronization of olfactory neurons originates in the antennal lobe and that slow temporal patterns in projection neurons can arise in the absence of temporal patterning of the afferent input.


Figures

Fig. 1.
Fig. 1.
Anatomy diagram showing the configuration of stimulating and recording electrodes. AL, Antennal lobe;AN, antennal nerve; B, bipolar stimulating electrode; LPL, lateral protocerebral lobe;MB, mushroom body; S, suction electrode;T1–4, planar array of tungsten stimulating electrodes;VKC, Kenyon cell intracellular recording electrode; VLFP, local field potential recording electrode;VPN, projection neuron intracellular recording electrode.
Fig. 2.
Fig. 2.
Odor presentation evoked fast oscillations in the mushroom body LFP, but no such oscillations were seen in simultaneously recorded antennal nerve activity. a, Presentation of isoamyl acetate (iaa). The antennal nerve recording showed a slow potential that took several seconds to decay. Odor presentation is indicated by the horizontal line. The onset of odor responses is indicated by thedotted vertical line. Inset, Power spectrum of unfiltered mushroom body LFP (responses to seven consecutive isoamyl acetate presentations) showing a peak at 20 Hz, with no such peak seen in the antennal nerve spectrum of the same trials. Dotted lines show 95% confidence levels. b, Recordings from an isolated antenna in response to charcoal-filtered, dried air and seven odors. The mean of five trials (blackline) is superimposed on a typical single trial (gray line). No oscillatory activity or slow temporal patterns were seen in the antennal recordings in response to these odors. Odor presentation (500 msec) is indicated by the horizontal bar.
Fig. 3.
Fig. 3.
a, Shock of the antennal nerve with a suction electrode produced a suprathreshold compound PSP, which contained a second peak (indicated by the arrow) ∼50 msec after the first. Two consecutive trials at the same intensity are superimposed (lower traces, thick andthin lines). b, Shock of theAL produced a compound PSP in an intracellularly recorded Kenyon cell (KC), with two peaks at an ∼50 msec interval. Two consecutive trials at the same intensity are superimposed (thick and thin lines).c, Prolonged (step) electrical stimulation of the antennal nerve with an electrode array generated oscillations inPN membrane potential and in the mushroom bodyLFP. Here three cycles are evoked. Two consecutive trials at the same intensity are superimposed (thick andthin lines). VAN, Stimulus waveform. d, e, Prolonged electrical stimulation of the antennal nerve with a suction electrode using sine- or ramp-shaped stimuli generated sustained oscillations inPN membrane potential and in the mushroom bodyLFP. Two consecutive trials at the same intensity are superimposed (thick and thin lines).f, g, The PN was hyperpolarized by current injection of −0.2 nA. f, Note the synchronization of PN membrane potential and mushroom body LFP. g, Cross-correlation of the traces in f is shown.h, Coherence function of PN membrane potential and unfiltered mushroom body LFP, computed over 13 trials, is shown. The dotted line indicates significant difference from zero (p = 0.05). Data in a and c–h are from the samePN.
Fig. 4.
Fig. 4.
Consistency of synchronizedPNLFP oscillations is shown by the superposition of traces from six consecutive trials (different animal from Fig. 3). LFP was filtered at 5–50 Hz; 500 msec step electrical stimulation by suction electrode, onset indicated by arrow, was used. Note that thedownward trend in the PN traces in this and other figures (see Figs. 5-8, 10b) is a stimulus artifact (see Materials and Methods).
Fig. 5.
Fig. 5.
Synchronization between PNs could be seen directly in paired intracellular recordings. a, Four consecutive traces are superimposed, showing consistent synchronization of the subthreshold membrane potential oscillations in these two PNs (PN1 andPN2). IPSPs are indicated by arrowheads.b, The membrane potential of two PNs and the mushroom body LFP all showed synchronized oscillations (LFP filtered at 5–50 Hz).PN1 consistently receives an initial EPSP in response to electrical stimulation, whereas PN2 received an initial IPSP (arrowhead) followed by EPSPs later in the trial. This suggests that different PNs can receive different temporal patterns of inputs from the same electrical stimulus. Ina and b, 500 msec step electrical stimulation by suction electrode, onset indicated byarrow, was used.
Fig. 6.
Fig. 6.
Pressure injection of picrotoxin into the AL disrupts the oscillations evoked by electrical stimulation in bothPNs and LFP. a, Single-trial responses of PN and LFPevoked by step electrical stimulation (with a suction electrode) before (thick line) and after (thin line) picrotoxin injection. Rhythmicity in both membrane potential andLFP is abolished after injection (LFPfiltered at 10–50 Hz). Response amplitude also increased after picrotoxin (PN hyperpolarized by −0.5 nA).b, Coherence between PN membrane potential and unfiltered mushroom body LFP computed over seven trials both before (pre) and after (post) picrotoxin injection. The peak at ∼30 Hz is absent after picrotoxin injection. The dotted lineindicates significant difference from zero (p = 0.05). c,d, Mean membrane potential and LFPcomputed before (c) and after (d) picrotoxin injection for the same 14 trials shown in b. Rhythmic EPSPs and phase-lockedLFP oscillations in c are indicated byarrowheads.
Fig. 7.
Fig. 7.
An intensity series showed that picrotoxin effects cannot be attributed to change in the stimulus threshold (samePN shown in Fig. 6). a, Oscillations are only evoked within a range of stimulus intensities (below which one or no cycles are evoked; above which only a population spike is evoked).b, After picrotoxin, no stimulus intensity can evoke oscillations.
Fig. 8.
Fig. 8.
Stimulation of either branch (a,b) of the antennal nerve evokes the same temporal pattern in a given PN. Two consecutive trials at the same intensity are superimposed, showing the consistency of the response. LFP was filtered at 10–50 Hz; 500 msec step electrical stimulation, onset indicated by arrow, was used.
Fig. 9.
Fig. 9.
a, Stimulating different subsets of afferent fibers generated different temporal PN response patterns. In this PN different patterns are apparent in the subthreshold activity. Single (thick line) and mean (thin line) responses are superimposed. Increased latency (and increased latency variability; see mean) is indicated by the arrow.S, Suction electrode stimulus. b, An intensity series shows that the different temporal patterns remained distinct across intensities. Intensities are in millivolts. ForT1T2 but not for T2T1, latency was a function of stimulus intensity.
Fig. 10.
Fig. 10.
Different PNs show distinct temporal responses to the same afferent volley. a, Increasing stimulus intensity from 165 to 220 mV caused a 160 msec decrease in PN response latency but only a 25 msec decrease in field potential response latency. For the 165 mV stimulus, the field potential response preceded the PN response by 146 msec, indicating that other PN responses must also precede that of the recorded PN. The PNis the same as that shown in Figure 9. b, Different temporal responses to a stimulus in two simultaneously recordedPNs are shown. c, The field potential response preceded the response of this PN by 32 msec. Ina–c, 500 msec step electrical stimulation, onset indicated by arrow, was used. LFP was filtered at 5–50 Hz (a) and 10–50 Hz (b, c).
Fig. 11.
Fig. 11.
Different spatial patterns of afferent stimulation (500 msec step, VAN) could evoke many different firing patterns. a, Firing patterns can be seen in individual traces. Delayed firing to the suction electrode stimulus (S) is attributable in part only to conduction time along the antennal nerve.b, Peristimulus time histograms (25 msec bins) and rasters show reliability of firing patterns. c, Five consecutive trials in response to stimulus T3T4 show the consistent early inhibition and late firing.
Fig. 12.
Fig. 12.
Responses to odors and electrical stimulation in the same PN. Three trials are superimposed in each condition. Apple and citral evoke initial inhibition followed by an epoch of excitation. Cineole leads to initial excitation followed by inhibition. Presentation of isoamyl acetate (iaa) evokes a mixed response with a weak subthreshold initial excitation (*), followed by epochs of inhibition and then excitation. Electrical stimulation with either T4T3 or T1T2 evokes initial inhibition followed by excitation. Close examination (inset) of the response to T1T2 reveals a fast initial IPSP (filled arrowhead) followed by a slow inhibitory component. The response to T3T1consists of a fast, subthreshold EPSP (*) followed by a slow inhibitory component. Stimulus onset artifacts are indicated by open arrowheads in insets.

References

    1. Adrian E. Olfactory reactions in the brain of the hedgehog. J Physiol (Lond) 1942;100:459–473. - PMC - PubMed
    1. Adrian E. The electrical activity of the mammalian olfactory bulb. Electroenceph Clin Neurophysiol. 1950;2:377–388. - PubMed
    1. Christensen T, Hildebrand J. Male-specific, sex pheromone-selective projection neurons in the antennal lobes of the moth Manduca sexta. J Comp Physiol [A] 1987;160:553–569. - PubMed
    1. Christensen T, Hildebrand J. Frequency coding by central olfactory neurons in the sphinx moth Manduca sexta. Chem Senses. 1988;13:123–130.
    1. Christensen T, Waldrop B, Harrow I, Hildebrand J. Local interneurons and information processing in the olfactory glomeruli of the moth Manduca sexta. J Comp Physiol [A] 1993;173:385–399. - PubMed

Publication types

Substances

LinkOut - more resources