. 1999 Jan 1;19(1):431-41.
doi: 10.1523/JNEUROSCI.19-01-00431.1999.

Effects of attention on orientation-tuning functions of single neurons in macaque cortical area V4

Affiliations

Effects of attention on orientation-tuning functions of single neurons in macaque cortical area V4

C J McAdams et al. J Neurosci. .

Abstract

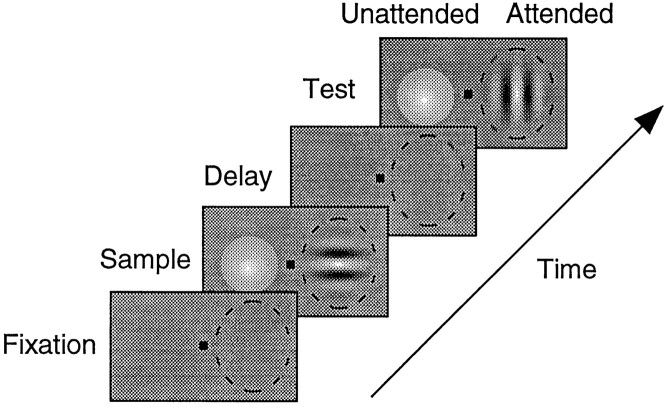
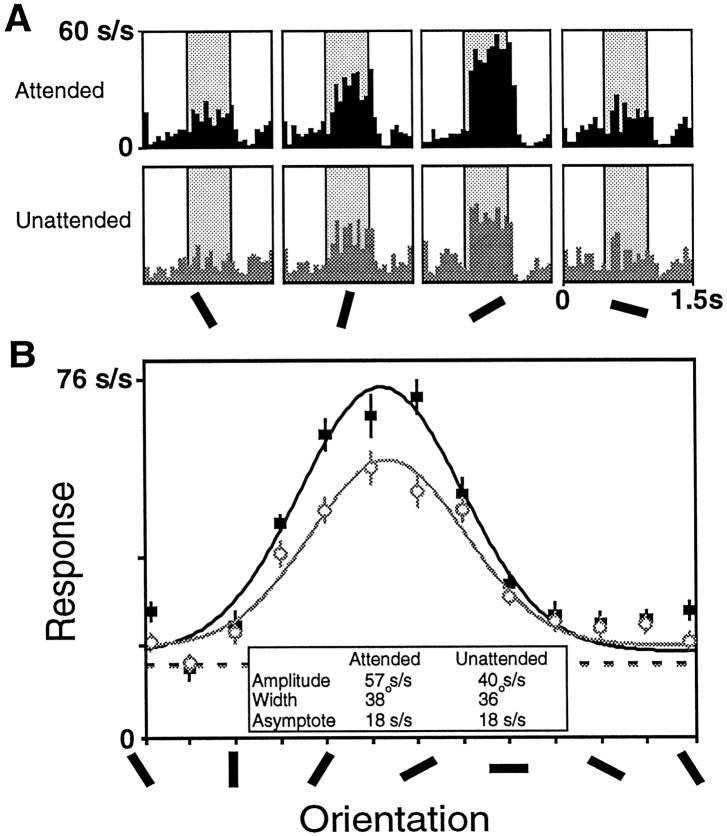
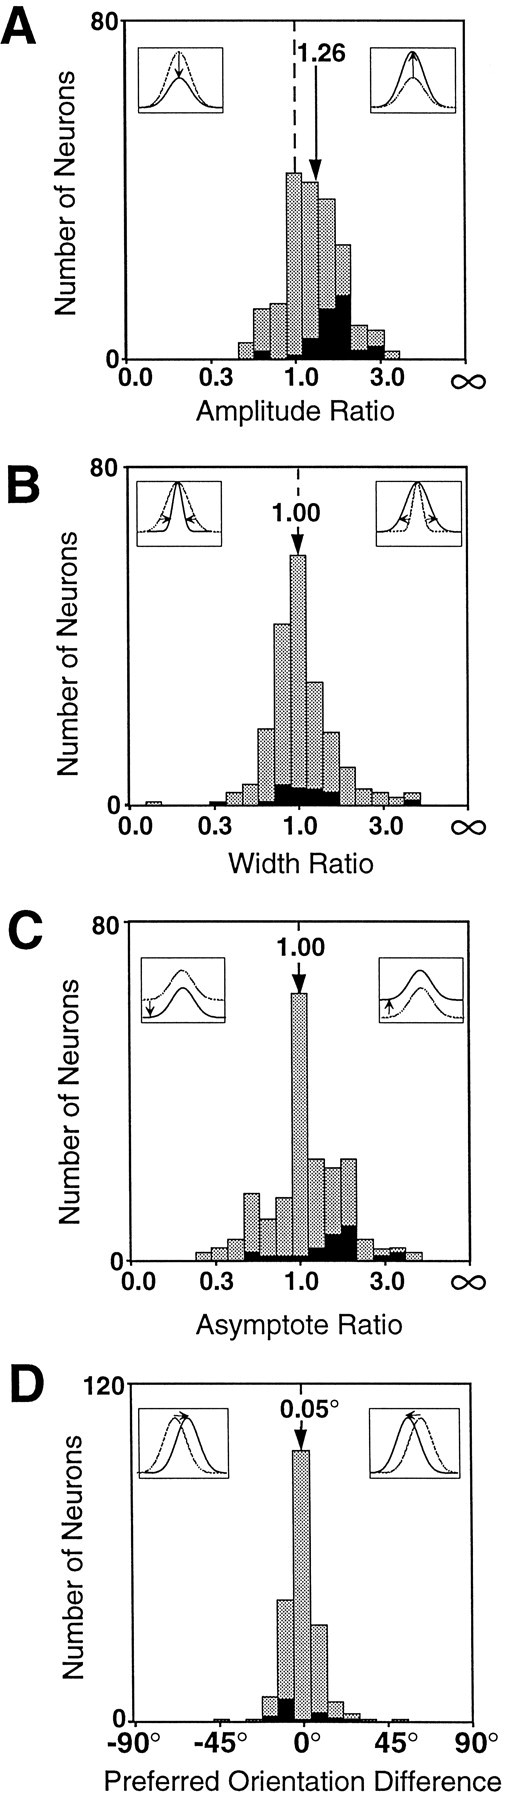
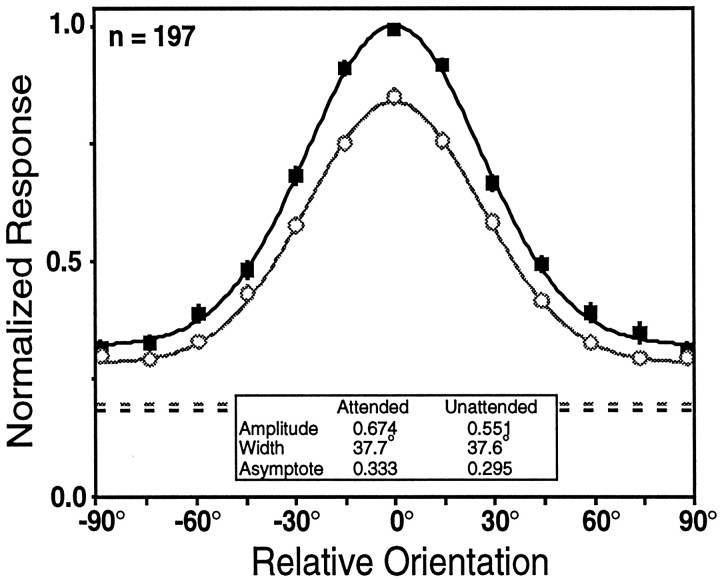
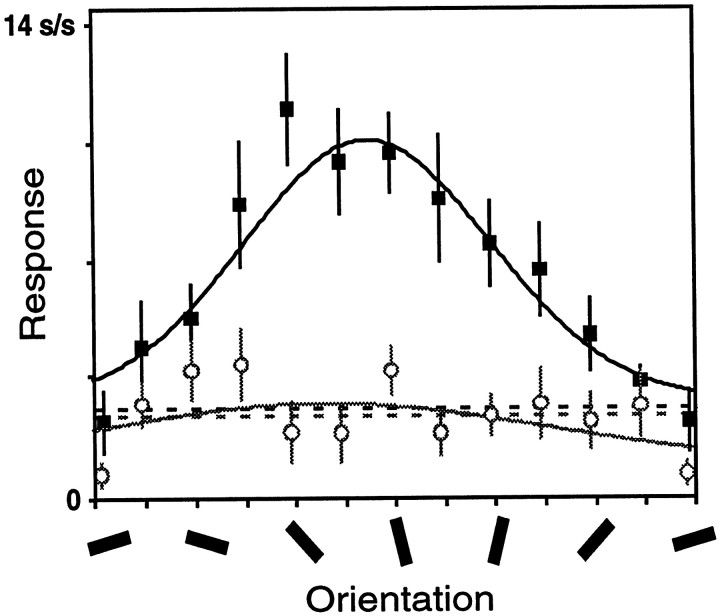
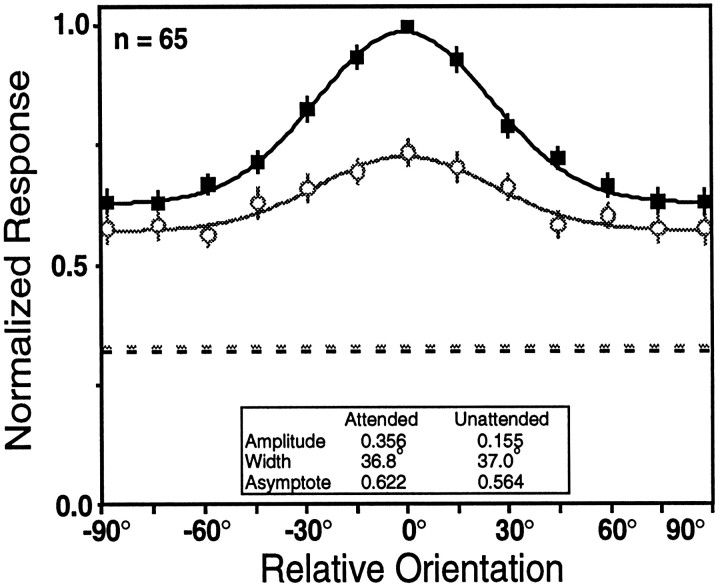
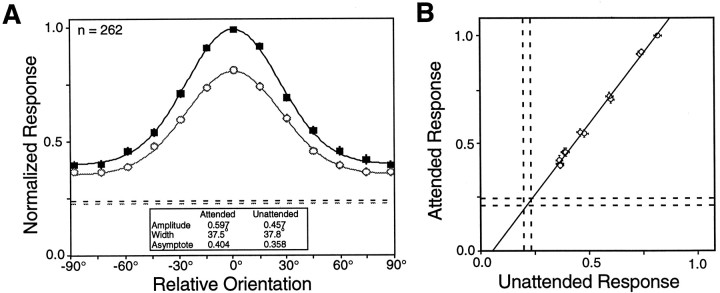
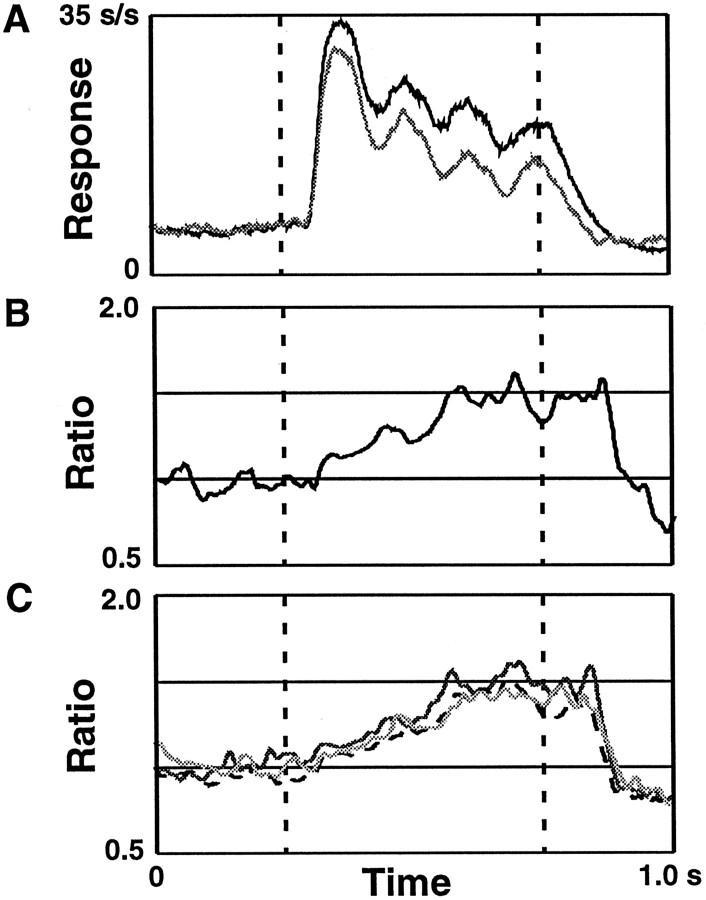
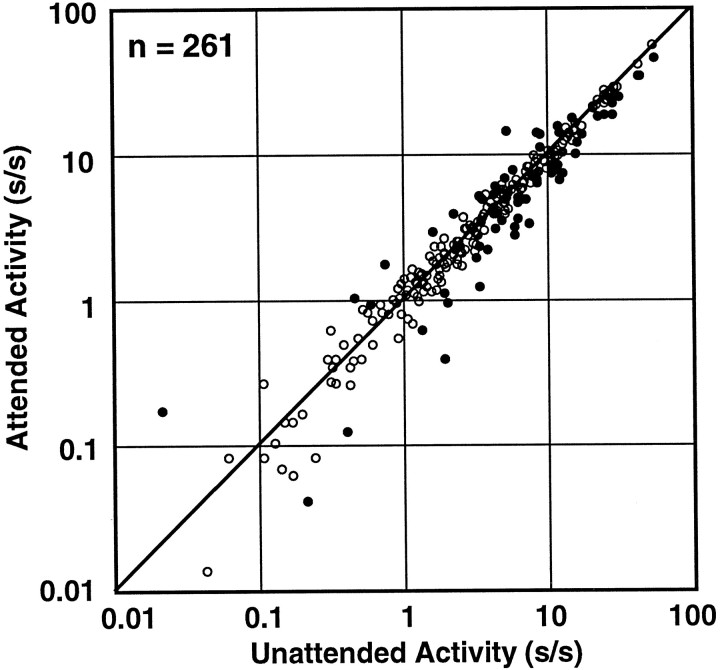
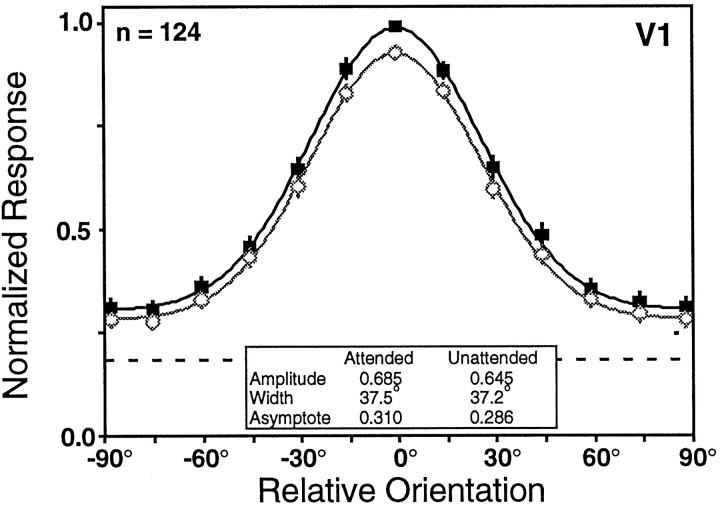
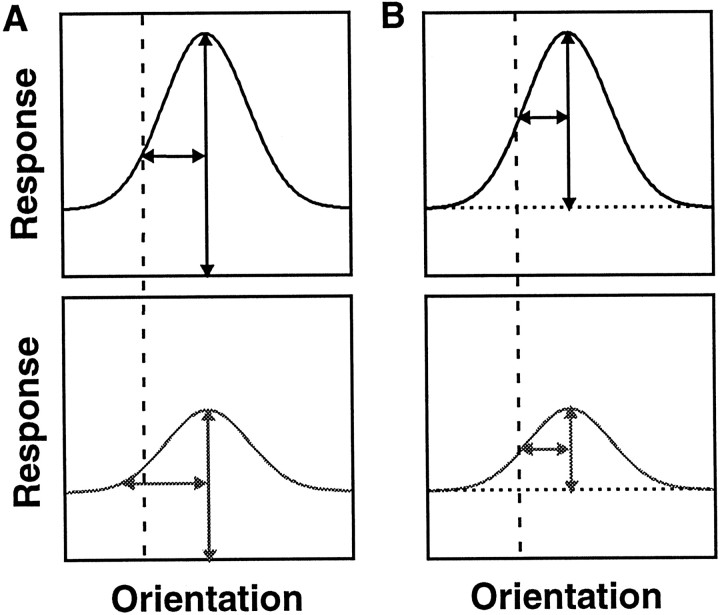
We examined how attention affected the orientation tuning of 262 isolated neurons in extrastriate area V4 and 135 neurons in area V1 of two rhesus monkeys. The animals were trained to perform a delayed match-to-sample task in which oriented stimuli were presented in the receptive field of the neuron being recorded. On some trials the animals were instructed to pay attention to those stimuli, and on other trials they were instructed to pay attention to other stimuli outside the receptive field. In this way, orientation-tuning curves could be constructed from neuronal responses collected in two behavioral states: one in which those stimuli were attended by the animal and one in which those stimuli were ignored by the animal. We fit Gaussians to the neuronal responses to twelve different orientations for each behavioral state. Although attention enhanced the responses of V4 neurons (median 26% increase) and V1 neurons (median 8% increase), selectivity, as measured by the width of its orientation-tuning curve, was not systematically altered by attention. The effects of attention were consistent with a multiplicative scaling of the driven response to all orientations. We also found that attention did not cause systematic changes in the undriven activity of the neurons.


Figures

Fig. 1.
Fig. 1.
Schematic representation of the delayed match-to-sample task. Each frame represents the display at a different point in a trial, with the fixation spot in thecenter and the receptive field of the neuron indicated by a dashed oval. The fixation, sample, and delay periods were each 500 msec. The test period could last 1000 msec, but ended when the animal released the lever. The monkey was required to bring his gaze to the fixation spot and depress a lever to begin the trial. A Gabor and a colored Gaussian were presented in the sample period. The monkey attended to only one of these stimuli in each trial, based on previous instruction trials in which only one stimulus appeared. In the attended mode, the monkey was required to pay attention to the orientation of the stimulus in the receptive field. In the other mode, the monkey was required to pay attention to the color of the stimulus outside the receptive field. Both stimuli were removed during the delay period. In the test period, the animal had to report whether the test stimulus at the attended location matched the sample stimulus previously presented there. In the case illustrated, if the animal had been instructed to pay attention to the oriented stimuli, the animal would be required to keep the lever depressed to receive a juice reward because the orientations do not match. Conversely, if the animal had been instructed to pay attention to the colored stimuli, the animal would be required to release the lever within 500 msec of the test stimulus onset to receive juice because the colors match.
Fig. 2.
Fig. 2.
Data from one V4 cell showing enhanced responses in the attended mode (black) relative to the unattended mode (gray). A, Histograms showing the responses elicited by sample stimuli of four different orientations. The histograms in the top row were taken from trials when the animal was attending to the receptive field stimulus, and the histograms in the bottom row were taken from trials when the animal was attending to the stimulus outside the receptive field. The average response during the sample period (shaded) was used to construct tuning curves.B, Tuning curves were constructed for this neuron for each task mode by fitting the responses for each condition to a Gaussian. This cell had a significant increase in amplitude in the attended mode (solid symbols) relative to the unattended mode (open symbols), but no significant changes in the preferred orientation, width, or asymptote. The undriven activity of the cell during the attended trials is shown in the black dashed line, and the undriven activity of the cell during the unattended trials is represented by the gray dashed line.
Fig. 3.
Fig. 3.
The changes in the parameters of orientation tuning by attention are characterized using index values for the amplitude (A), width (B), asymptote (C), and the difference in preferred orientation (D). The index value is the difference in the fitted Gaussian parameters, (attended − unattended) divided by their sum (attended + unattended). The index value was selected for binning because it is bounded for both positive and negative changes, but the axis is labeled in the corresponding ratios. All of the plots display the changes in the fitted parameters for the 197 V4 neurons whose orientation-tuning curves were well fit by a Gaussian. Cells showing individually significant changes in a given parameter are drawn in black.
Fig. 4.
Fig. 4.
The population-tuning curves for the V4 neurons that were tuned in both the attended (solid squares) and unattended (open circles) task modes. The preferred orientation for each cell was estimated for the purpose of aligning the population-tuning curves by smoothing the data sets of each neuron, fitting Gaussians to the smoothed data for each task mode, and then averaging the fitted attended and unattended preferred orientations. Gaussians were then fit to the averaged data for each behavioral mode. The dashed lines represent the average undriven activity, measured as the firing rate during the fixation period for all trials for each task mode, with the darker linecorresponding to the undriven activity during the attended mode and thelighter line corresponding to the undriven activity during the unattended mode.
Fig. 5.
Fig. 5.
Tuning curves for a single V4 unit that had acceptable orientation tuning in the attended mode (black) but not in the unattended mode (gray). Same format as in Figure2B.
Fig. 6.
Fig. 6.
Population-tuning curves for the V4 neurons that were not well fit by a Gaussian tuning curve in one or both task modes. Same format as in Figure 4. Both the attended (black) and unattended (gray) population-tuning curves reach our criterion for orientation tuning. Although there is a large difference in amplitude, there is little difference in the width of the curves.
Fig. 7.
Fig. 7.
A, The normalized population-tuning curves for all V4 neurons. Same format as in Figure 4. Although there is a large difference in amplitude, there is little difference in the widths of the curves. B, The attended response is plotted against the unattended response for each of the 12 orientations. The line shown is the linear regression of the attended responses on the unattended responses. It has a slope of 1.32, corresponding to a 32% increase in response with attention. The pairs of dashed lines mark ± 1 SEM undriven activity. The excellent fit (r2 = 1.00) and the intersection with the undriven activity are consistent with a multiplicative scaling of the evoked responses.
Fig. 8.
Fig. 8.
The time course of the attentional effect.A, Population histograms of the activity in response to the preferred orientation are shown for the attended (black) and unattended (gray) modes. The dashed lines indicate stimulus start and stop. B, The ratio of the attended activity relative to the unattended activity from the population histograms inA is shown. C, The ratios for three other stimulus orientations. The darkest line corresponds to a stimulus orientations 15° away from the preferred orientation of each cell, the next darkest line is a stimulus orientation 45° from the preferred orientation, and the lightestline corresponds to a stimulus orientation 75° from the preferred orientation. Although these stimuli resulted in responses of different magnitudes, the attentional modulation has the same time course and same proportional enhancement.
Fig. 9.
Fig. 9.
Undriven activity. The undriven activity for each neuron, measured as the average firing rate during the fixation period for the attended mode is plotted against the undriven activity generated in the unattended mode of the task. The solid circles are those cells with individually significant changes in activity (t test; p < 0.05) across conditions. One V4 cell was excluded because it had zero undriven activity in one condition.
Fig. 10.
Fig. 10.
The population-tuning curves for V1 neurons for the attended (black solid squares) and unattended (gray open circles) task modes. Only 124 of the total 135 V1 neurons recorded could be used to construct these population-tuning curves because we used a 10° sample spacing for 11 finely tuned V1 neurons, rather than the 15° sample spacing used for all V4 and most of the V1 neurons. The dashed lineindicates the relative magnitude of the undriven activity, which did not differ across the conditions. The overall increase in response amplitude in V1 was ∼6%.
Fig. 11.
Fig. 11.
Effects of changes in response strength on different measures of width. The top panels are multiplicatively scaled versions of the tuning function in the lower panels. A, Height measured relative to undriven activity or zero activity. The vertical double-headed arrow is the assigned height of each curve, at which thex-axis represents either undriven activity or no activity. The horizontal double-headed arrow is the half-width at half-height. The width differs for the two curves (vertical dashed line). B, Height measured relative to the asymptote of the tuning function. Thevertical double-headed arrow is the assigned height of each curve, at which the dotted linerepresents the asymptote of the tuning function. The horizontal double-headed arrow is the half-width at half-height. The width is the same for the two curves (vertical dashed line).

References

    1. Adelson EH, Bergen JR. Spatiotemporal energy models for the perception of motion. J Opt Soc Am. 1985;2:284–299. - PubMed
    1. Albrecht DG, Geisler WS. Motion selectivity and the contrast-response function of simple cells in the visual cortex. Vis Neurosci. 1991;7:531–546. - PubMed
    1. Albrecht DG, Hamilton DB. Striate cortex of monkey and cat: contrast response function. J Neurophysiol. 1982;48:217–237. - PubMed
    1. Andersen RA, Essick GK, Siegel R. The encoding of spatial location by posterior parietal neurons. Science. 1985;230:456–458. - PubMed
    1. Bisti S, Carmignoto G, Galli L, Maffei L. Spatial-frequency characteristics of neurones of area 18 in the cat: dependence on the velocity of the visual stimulus. J Physiol (Lond) 1985;359:259–268. - PMC - PubMed

Publication types

LinkOut - more resources