. 1999 Jan;65(1):45-52.
doi: 10.1128/AEM.65.1.45-52.1999.

Enumeration of marine viruses in culture and natural samples by flow cytometry

Affiliations

Enumeration of marine viruses in culture and natural samples by flow cytometry

D Marie et al. Appl Environ Microbiol. 1999 Jan.

Abstract

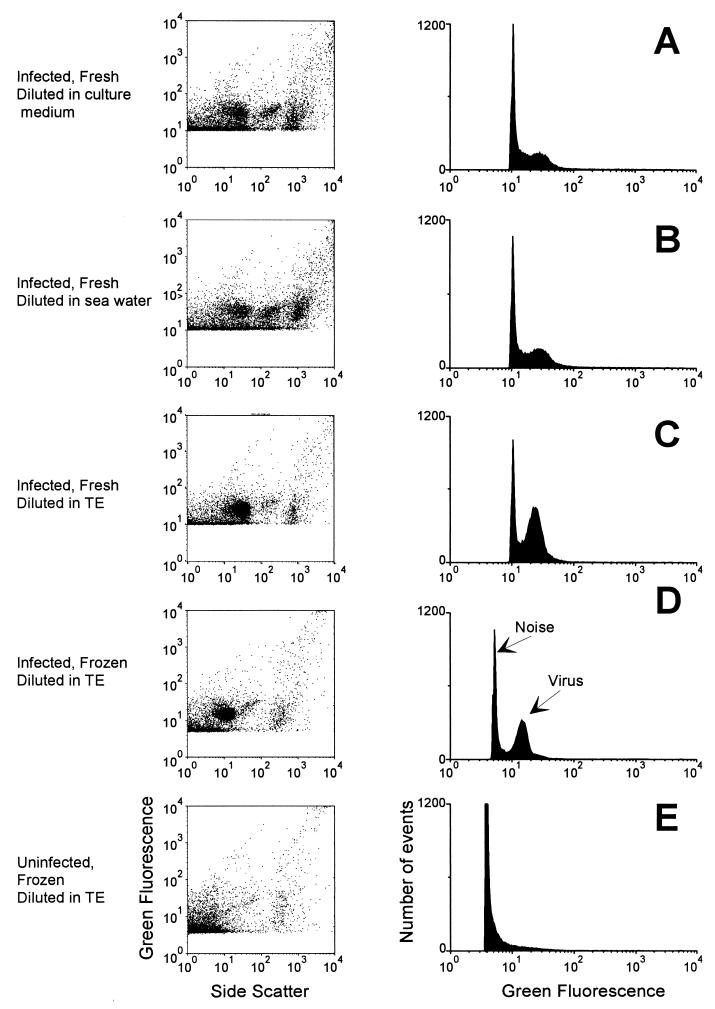
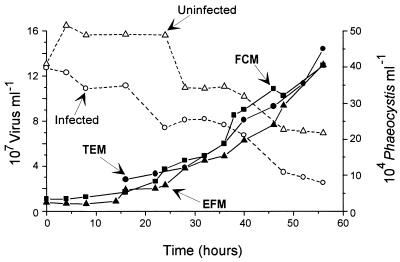
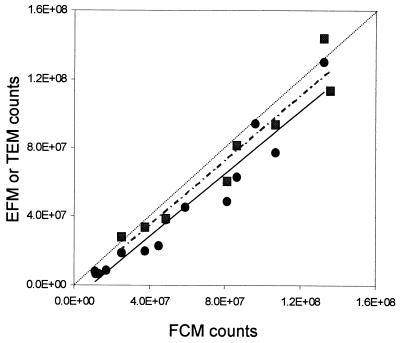
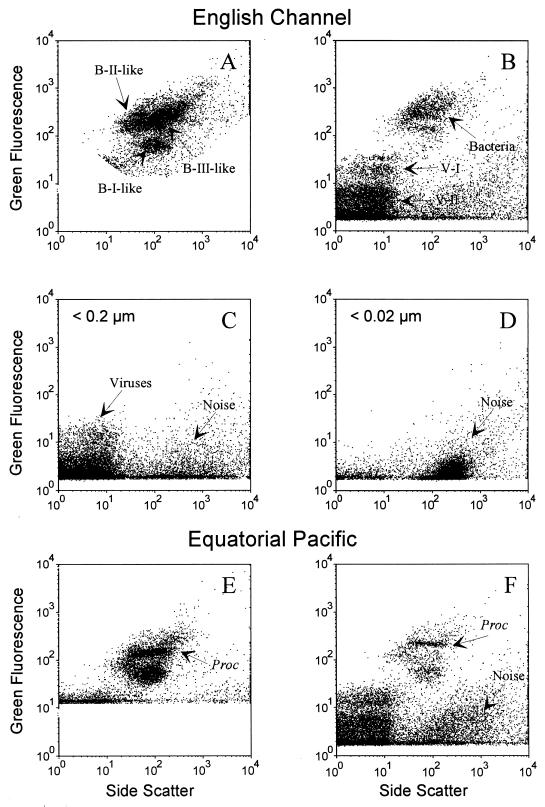
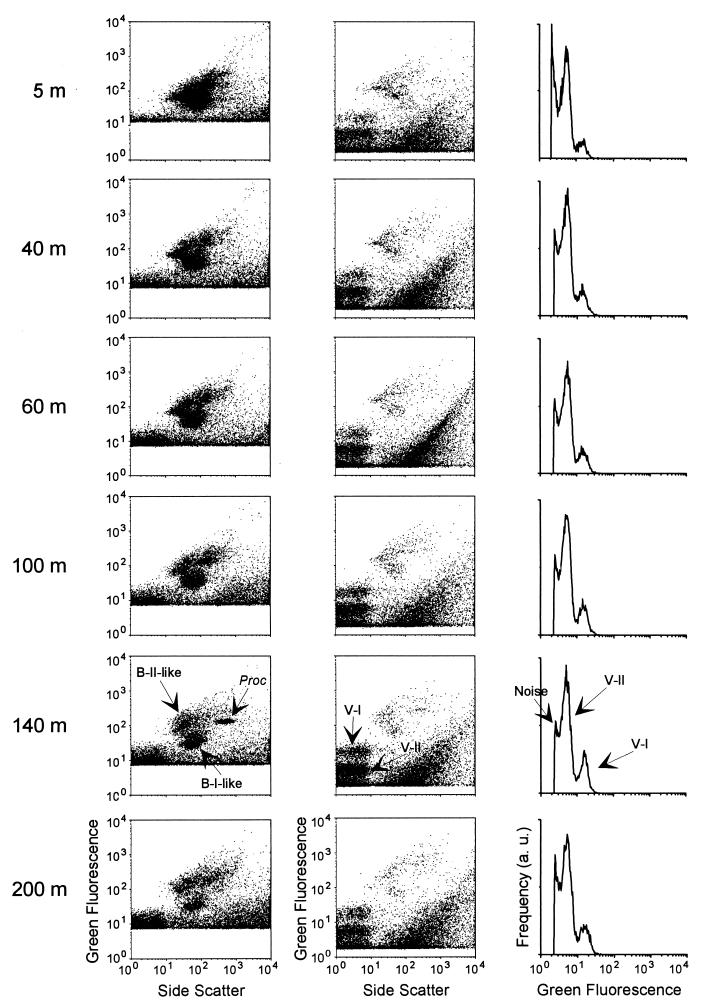
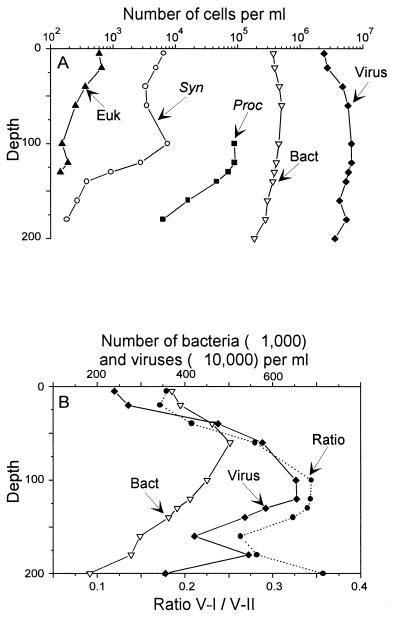
Flow cytometry (FCM) was successfully used to enumerate viruses in seawater after staining with the nucleic acid-specific dye SYBR Green-I. The technique was first optimized by using the Phaeocystis lytic virus PpV-01. Then it was used to analyze natural samples from different oceanic locations. Virus samples were fixed with 0.5% glutaraldehyde and deep frozen for delayed analysis. The samples were then diluted in Tris-EDTA buffer and analyzed in the presence of SYBR Green-I. A duplicate sample was heated at 80 degreesC in the presence of detergent before analysis. Virus counts obtained by FCM were highly correlated to, although slightly higher than, those obtained by epifluorescence microscopy or by transmission electron microscopy (r = 0.937, n = 14, and r = 0.96, n = 8, respectively). Analysis of a depth profile from the Mediterranean Sea revealed that the abundance of viruses displayed the same vertical trend as that of planktonic cells. FCM permits us to distinguish between at least two and sometimes three virus populations in natural samples. Because of its speed and accuracy, FCM should prove very useful for studies of virus infection in cultures and should allow us to better understand the structure and dynamics of virus populations in natural waters.


Figures

FIG. 1
FIG. 1
FCM analysis of P. pouchetii samples collected 24 h after the beginning of a viral infection experiment. Samples were analyzed after fixation with 0.5% glutaraldehyde and staining with 5 × 10⁻⁴ of the commercial solution of SYBR-I. (Left) Side scatter versus green DNA fluorescence (SYBR-I). (Right) Monoparametric green DNA fluorescence distribution of viruses. Each histogram contains 10,000 events. (A to D) Infected cultures; (E) uninfected culture. Samples were analyzed either immediately after fixation (A to C) or following freezing in liquid nitrogen and storage at −80°C (D and E). Samples were diluted in culture medium (A), 0.2-μm-pore-size-filtered seawater (B), or TE buffer (C to E).
FIG. 2
FIG. 2
Infection experiment of P. pouchetii. Phaeocystis cells were enumerated by FCM for uninfected (open triangles) and infected (open circles) cultures. Virus counts were performed by three different techniques: EFM (solid triangles), TEM (solid circles), and FCM (solid squares). Virus counts reported for FCM correspond to the average value of counts obtained on 0.5% glutaraldehyde-fixed samples, frozen in liquid nitrogen, at different dilutions and analyzed after incubation at room temperature (Table 1) or after heating at 80°C in the presence of Triton X-100.
FIG. 3
FIG. 3
Infection experiment of P. pouchetii. Comparison between FCM, EFM, and TEM virus counts obtained for samples collected every 4 h (Fig. 2; Table 1). FCM versus EFM (solid circles, straight line; EFM = 0.91 × FCM − 8.5 × 10⁶, r = 0.97, n = 14). FCM versus TEM (solid squares, dotted line, FCM = 0.95 × TEM − 3.7 × 10⁶, r = 0.96, n = 8). The dashed line corresponds to a 1:1 relationship.
FIG. 4
FIG. 4
Side scatter versus green fluorescence (SYBR-I) for surface samples collected in the English Channel and in the Equatorial Pacific and analyzed by FCM. Samples were run undiluted to enumerate bacteria (A and E). Then different dilutions were made to analyze viruses (B and F). Data obtained after filtration of seawater from the English Channel, through 0.2- or 0.02-μm-pore-size filters, and stained by SYBR-I are shown (C and D). Only data from a 1:50 dilution are presented. Proc, Prochlorococcus; B-I, B-II, B-III, bacteria subpopulations; V-I, V-II, virus subpopulations.
FIG. 5
FIG. 5
FCM analysis of seawater samples collected at different depths on a vertical profile in the Mediterranean Sea (18°E, 34°N) on 18 June 1996 (MINOS cruise, cast 118). Six representative depths among 12 sampled are shown. Bacteria (left) were enumerated in undiluted samples stained with 10−4 SYBR-I. For virus analysis (middle), samples were diluted 100-fold and stained with 5 × 10⁻⁵ SYBR-I. Monoparametric green fluorescence distributions (right), obtained after computation by CYTOWIN and corresponding to the virus populations, are also shown.
FIG. 6
FIG. 6
Vertical distributions of Prochlorococcus (Proc; solid squares), Synechococcus (Syn; open circles), picoeukaryotes (Euk; solid triangles), bacteria (Bact; open triangles), and viruses (solid diamonds) and ratio between V-II and V-I (stars, dashed line) obtained by FCM for a vertical profile collected in the Mediterranean Sea (18°E, 34°N) on 18 June 1996 (MINOS cruise, cast 111). Samples were collected in Niskin bottles from 200 m up to the surface. Phytoplanktonic cells and bacteria were enumerated onboard. Prochlorococcus was undetectable from the surface down to 80 m because of its weak red chlorophyll fluorescence. Viruses were analyzed on paraformaldehyde-preserved samples, and the numbers result from the average of counts obtained on samples diluted 1:100 and 1:200 in TE buffer. (A) Logarithmic scale. (B) Linear scale.

References

    1. Bergh Ø, Børsheim K Y, Bratbak G, Heldal M. High abundance of viruses found in aquatic environments. Nature. 1989;340:467–468. - PubMed
    1. Bratbak G, Heldal M, Norland S, Thingstad T F. Viruses as partners in spring bloom microbial trophodynamics. Appl Environ Microbiol. 1990;56:1400–1405. - PMC - PubMed
    1. Bratbak G, Heldal M. Total count of viruses in aquatic environments. In: Kemp P F, Sherr B F, Sherr E B, Cole J J, editors. Current methods in aquatic microbial ecology. London, England: Lewis Publishers; 1993. pp. 135–138.
    1. Bratbak G, Egge J K, Heldal M. Viral mortality of the marine alga Emiliania huxleyi (Haptophyceae) and termination of algal blooms. Mar Ecol Prog Ser. 1993;93:39–48.
    1. Børsheim K Y, Bradbak G, Heldal M. Enumeration and biomass estimation of planktonic bacteria and viruses by transmission electron microscopy. Appl Environ Microbiol. 1990;56:352–356. - PMC - PubMed

LinkOut - more resources