Thermal gradient gel electrophoresis analysis of bioprotection from pollutant shocks in the activated sludge microbial community
- PMID: 9872766
- PMCID: PMC90989
- DOI: 10.1128/AEM.65.1.102-109.1999
Thermal gradient gel electrophoresis analysis of bioprotection from pollutant shocks in the activated sludge microbial community
Abstract
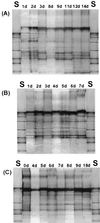
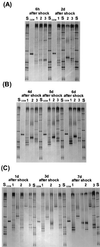
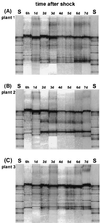
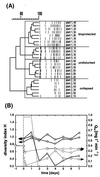
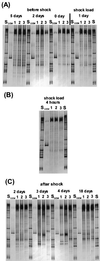
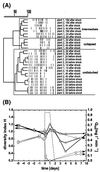
We used a culture-independent approach, namely, thermal gradient gel electrophoresis (TGGE) analysis of ribosomal sequences amplified directly from community DNA, to determine changes in the structure of the microbial community following phenol shocks in the highly complex activated sludge ecosystem. Parallel experimental model sewage plants were given shock loads of chlorinated and methylated phenols and simultaneously were inoculated (i) with a genetically engineered microorganism (GEM) able to degrade the added substituted phenols or (ii) with the nonengineered parental strain. The sludge community DNA was extracted, and 16S rDNA was amplified and analyzed by TGGE. To allow quantitative analysis of TGGE banding patterns, they were normalized to an external standard. The samples were then compared with each other for similarity by using the coefficient of Dice. The Shannon index of diversity, H, was calculated for each sludge sample, which made it possible to determine changes in community diversity. We observed a breakdown in community structure following shock loads of phenols by a decrease in the Shannon index of diversity from 1.13 to 0.22 in the noninoculated system. Inoculation with the GEM (Pseudomonas sp. strain B13 SN45RE) effectively protected the microbial community, as indicated by the maintenance of a high diversity throughout the shock load experiment (H decreased from 1.03 to only 0.82). Inoculation with the nonengineered parental strain, Pseudomonas sp. strain B13, did not protect the microbial community from being severely disturbed; H decreased from 1.22 to 0.46 for a 3-chlorophenol-4-methylphenol shock and from 1.03 to 0.70 for a 4-chlorophenol-4-methylphenol shock. The catabolic trait present in the GEM allowed for bioprotection of the activated sludge community from breakdown caused by toxic shock loading. In-depth TGGE analysis with similarity and diversity algorithms proved to be a very sensitive tool to monitor changes in the structure of the activated sludge microbial community, ranging from subtle shifts during adaptation to laboratory conditions to complete collapse following pollutant shocks.
Figures

Similar articles
-
Bioprotection of microbial communities from toxic phenol mixtures by a genetically designed pseudomonad.Nat Biotechnol. 1997 Apr;15(4):378-82. doi: 10.1038/nbt0497-378. Nat Biotechnol. 1997. PMID: 9094142
-
An outbreak of nonflocculating catabolic populations caused the breakdown of a phenol-digesting activated-sludge process.Appl Environ Microbiol. 1999 Jul;65(7):2813-9. doi: 10.1128/AEM.65.7.2813-2819.1999. Appl Environ Microbiol. 1999. PMID: 10388669 Free PMC article.
-
Response to shock load of engineered nanoparticles in an activated sludge treatment system: Insight into microbial community succession.Chemosphere. 2016 Feb;144:1837-44. doi: 10.1016/j.chemosphere.2015.10.084. Epub 2015 Nov 11. Chemosphere. 2016. PMID: 26539708
-
Molecular detection, isolation, and physiological characterization of functionally dominant phenol-degrading bacteria in activated sludge.Appl Environ Microbiol. 1998 Nov;64(11):4396-402. doi: 10.1128/AEM.64.11.4396-4402.1998. Appl Environ Microbiol. 1998. PMID: 9797297 Free PMC article.
-
Fate of genetically-engineered bacteria in activated sludge microcosms.Schriftenr Ver Wasser Boden Lufthyg. 1988;78:267-76. Schriftenr Ver Wasser Boden Lufthyg. 1988. PMID: 3074483 Review.
Cited by
-
Biofilm formation and microbial community analysis of the simulated river bioreactor for contaminated source water remediation.Environ Sci Pollut Res Int. 2012 Jun;19(5):1584-93. doi: 10.1007/s11356-011-0649-3. Epub 2011 Nov 27. Environ Sci Pollut Res Int. 2012. PMID: 22120124
-
Bioaugmentation as a tool to protect the structure and function of an activated-sludge microbial community against a 3-chloroaniline shock load.Appl Environ Microbiol. 2003 Mar;69(3):1511-20. doi: 10.1128/AEM.69.3.1511-1520.2003. Appl Environ Microbiol. 2003. PMID: 12620837 Free PMC article.
-
Species diversity improves the efficiency of mercury-reducing biofilms under changing environmental conditions.Appl Environ Microbiol. 2002 Jun;68(6):2829-37. doi: 10.1128/AEM.68.6.2829-2837.2002. Appl Environ Microbiol. 2002. PMID: 12039739 Free PMC article.
-
Bioaugmentation of activated sludge by an indigenous 3-chloroaniline-degrading Comamonas testosteroni strain, I2gfp.Appl Environ Microbiol. 2000 Jul;66(7):2906-13. doi: 10.1128/AEM.66.7.2906-2913.2000. Appl Environ Microbiol. 2000. PMID: 10877785 Free PMC article.
-
Molecular characterization of activated sludge from a seawater-processing wastewater treatment plant.Microb Biotechnol. 2011 Sep;4(5):628-42. doi: 10.1111/j.1751-7915.2011.00256.x. Epub 2011 Mar 17. Microb Biotechnol. 2011. PMID: 21414181 Free PMC article.
References
-
- ATV-Handbuch der Abwassertechnik. Biologische und weitergehende Abwasserreinigung. Berlin, Germany: Ernst & Sohn; 1997.
-
- Cilia V, Lafay B, Christen R. Sequence heterogeneities among 16S ribosomal RNA sequences, and their effect on phylogenetic analyses at the species level. Mol Biol Evol. 1996;13:451–461. - PubMed
-
- Dorn E, Hellwig M, Reineke W, Knackmuss H-J. Isolation and characterization of a 3-chlorobenzoate degrading pseudomonad. Arch Microbiol. 1974;99:61–70. - PubMed
-
- Erb R W, Eichner C A, Wagner-Döbler I, Timmis K N. Bioprotection of microbial communities from toxic phenol mixtures by a genetically designed pseudomonad. Nat Biotechnol. 1997;15:378–382. - PubMed
Publication types
MeSH terms
Substances
LinkOut - more resources
Full Text Sources
Other Literature Sources
Research Materials

