. 1999 Jan 4;189(1):13-24.
doi: 10.1084/jem.189.1.13.

A T cell receptor-specific blockade of positive selection

Affiliations

A T cell receptor-specific blockade of positive selection

K K Baldwin et al. J Exp Med. .

Abstract

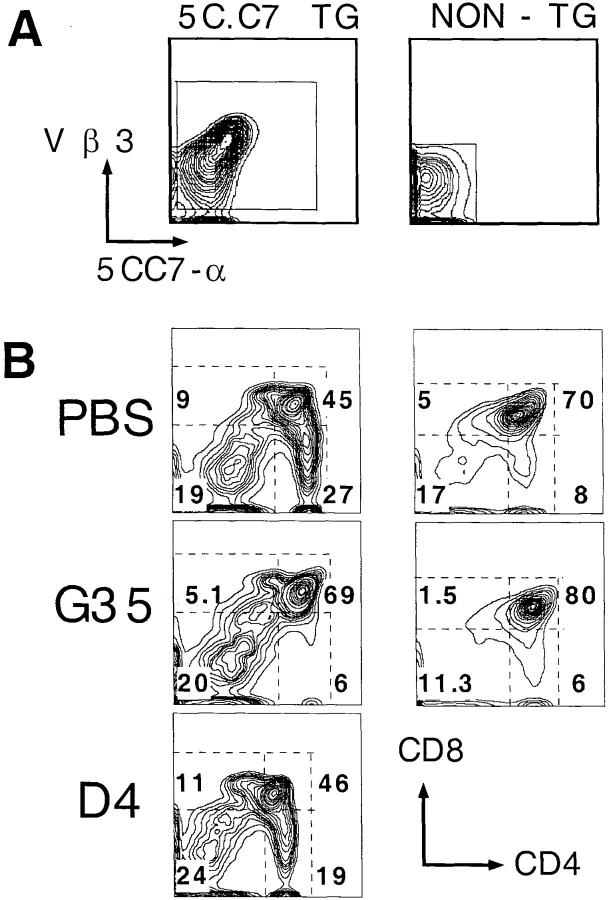
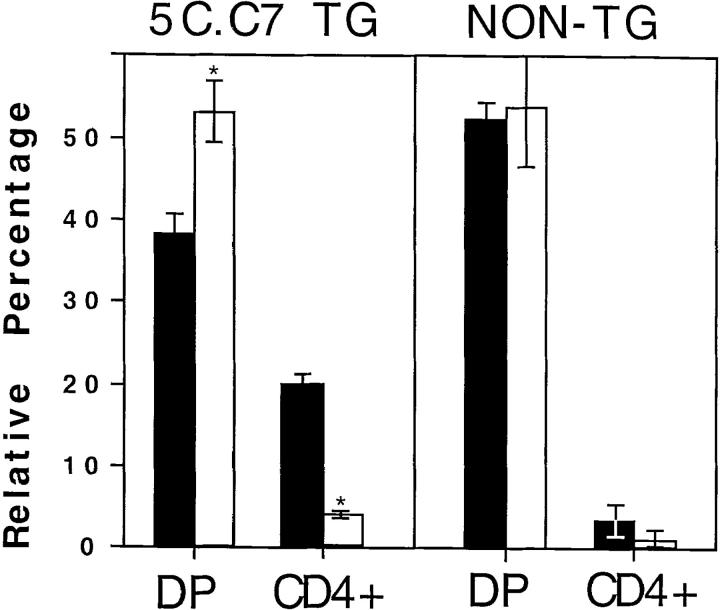
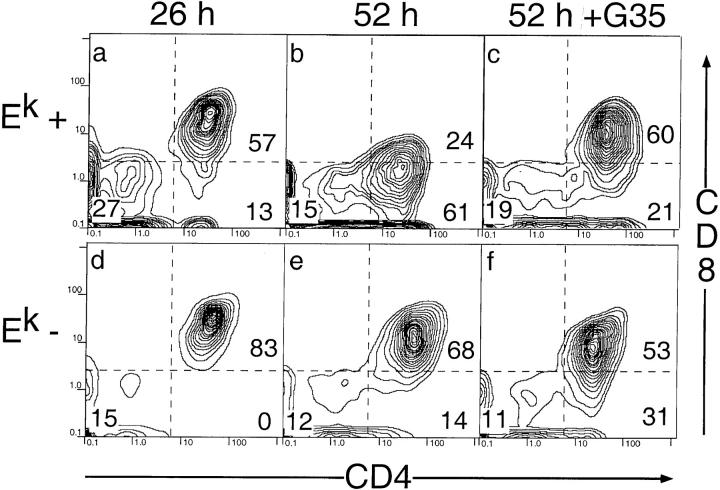
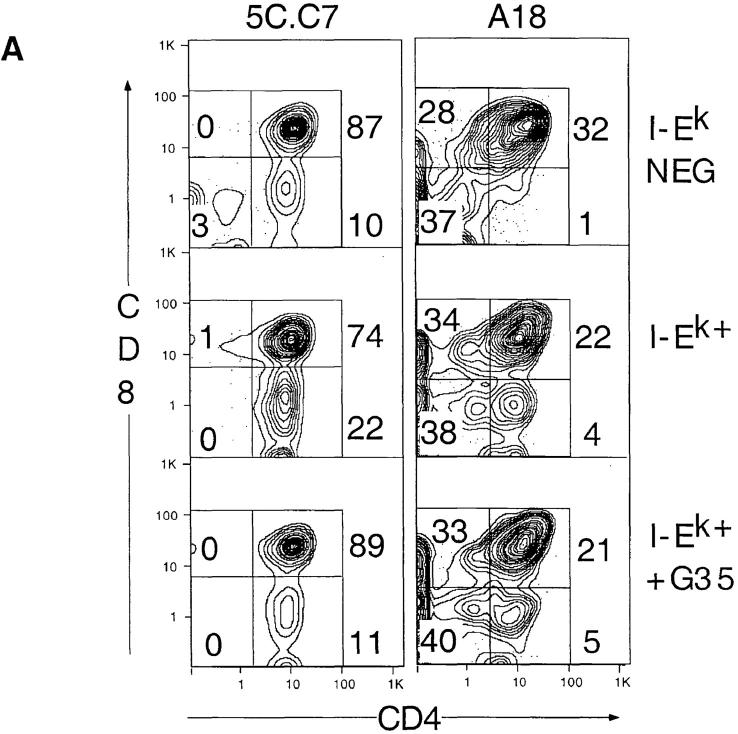
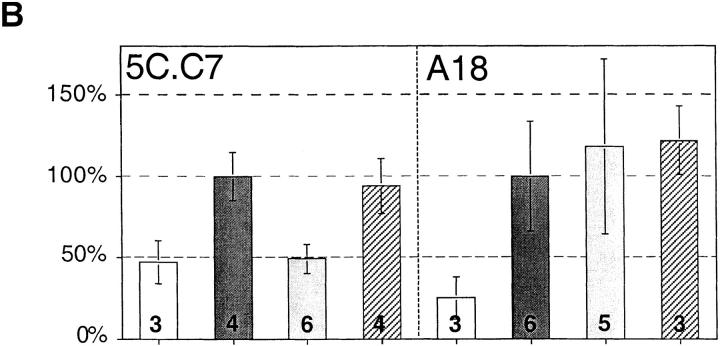
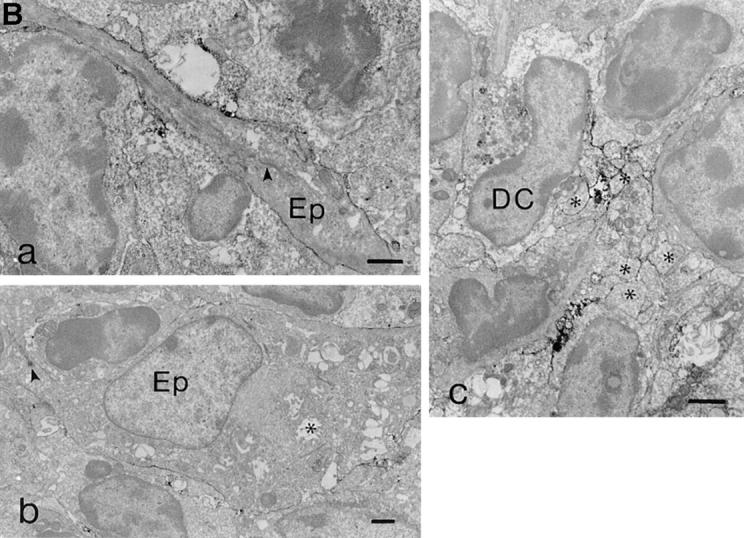
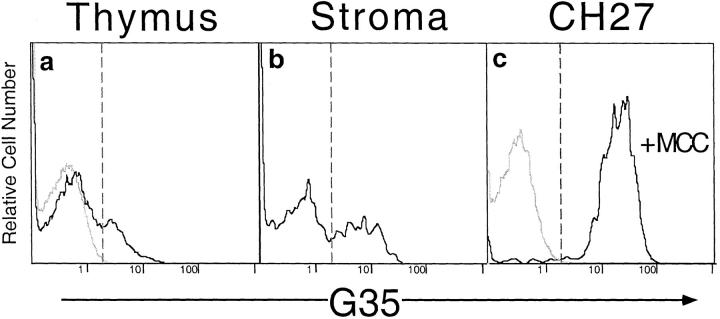
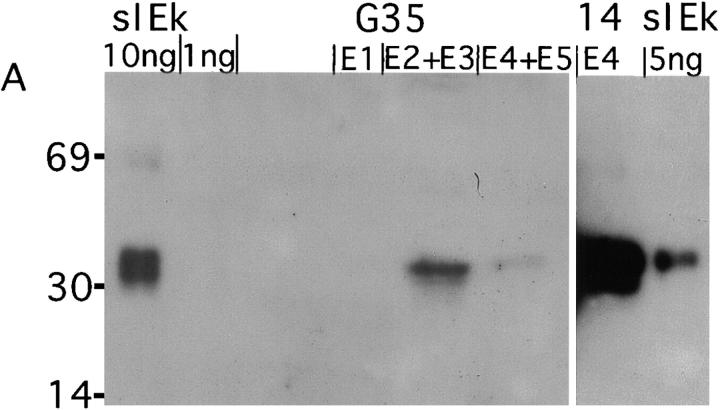
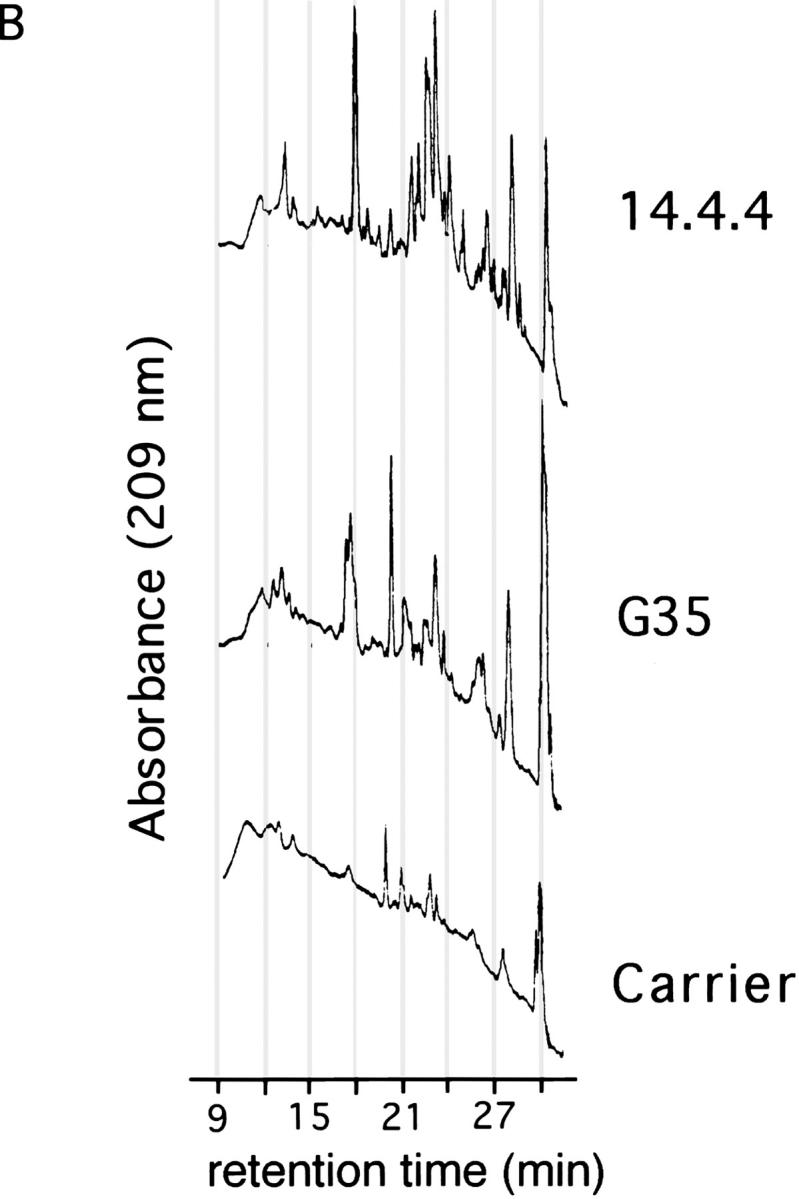
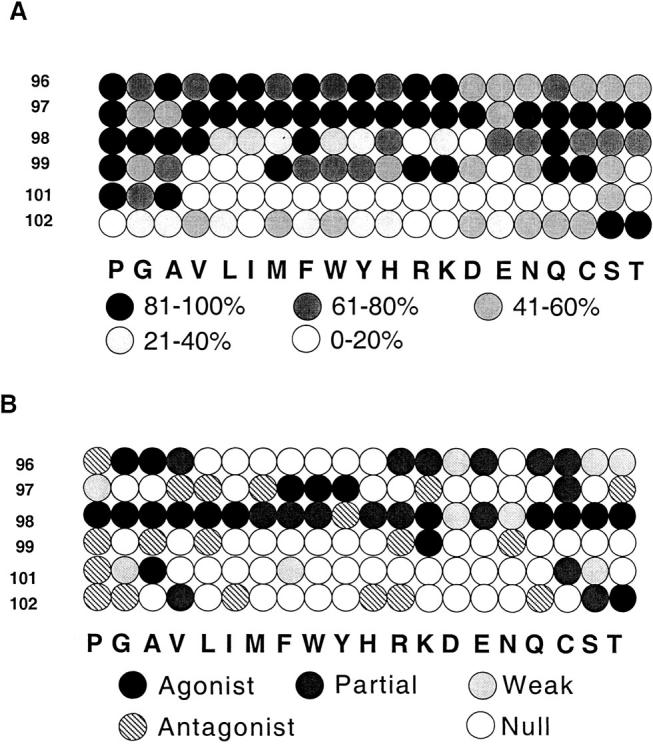
To investigate the influence of endogenous peptides on the developmental processes that occur during thymocyte selection, we have used monoclonal antibodies that preferentially recognize the major histocompatibility complex (MHC) molecule I-Ek when it is bound to the moth cytochrome c peptide (88-103). One of these antibodies (G35) specifically blocks the positive selection of transgenic thymocytes expressing a T cell receptor that is reactive to this peptide- MHC complex. Furthermore, G35 does not block the differentiation of transgenic T cells bearing receptors for a different I-Ek-peptide complex. This antibody recognizes a subset of endogenous I-Ek-peptide complexes found on a significant fraction of thymic antigen-presenting cells, including cortical and medullary epithelial cells. The sensitivity of G35 to minor alterations in peptide sequence suggests that the thymic peptide-MHC complexes that mediate the positive selection of a particular class II MHC-restricted thymocyte are structurally related to the complexes that can activate it in the periphery.


Figures

Figure 1
Figure 1
Effect of G35 on the selection of 5C.C7 transgenic thymocytes. (A) Distribution of 5C.C7-α chain and KJ25 (Vβ3) determinants on thymocytes derived from transgenic (left) or nontransgenic (right) pups. (B) Distribution of CD4 and CD8 on separate populations of cells derived from transgenic or nontransgenic pups exposed in utero to G35, PBS, or D4 as indicated. Numbers refer to the percentage of total live transgenic or nontransgenic thymocytes that fall within each boxed population.
Figure 2
Figure 2
Effects of antibody treatment on thymocyte subpopulations. The figure shows the average percentage of total live cells with the indicated CD4/ CD8 expression patterns from three to five transgenic or nontransgenic neonates born to mothers treated with G35 (white bars) or PBS (black bars). Error bars represent 1 SD.
Figure 3
Figure 3
G35 blocks 5C.C7 transgenic T cell differentiation in vitro. Analysis of CD4/8 expression on thymocytes removed from stromal cell cultures derived from B10.Br (top) or C57BL/6 (bottom) mice after 26 (a and d) or 52 h (b, c, e, and f). G35 was added to a final concentration of 50 μg/ml in c and f. Numbers on plots refer to the percent of total live transgenic thymocytes that fall within each boxed population.
Figure 4
Figure 4
Inhibition of positive selection by G35 is specific for the MCC-I-Ek–restricted TCR. (A) Immature thymocytes from 5C.C7/B10.Br or A18/AKR/J TCR transgenic mice were cultured with thymic stromal cells from C57BL/6 (top) B10.Br (middle) or AKR/J (bottom) mice. Numbers on plots refer to the percentage of total live transgenic thymocytes that fall within each boxed population. (B) Analysis of the effects of G35 on production of CD4+ cells. The selection index was generated for each treatment group by computing the average percentage of CD4+8/CD4+8+ for untreated, I-Ek–positive stromal cells on each day and comparing the average percentage of CD4+8/CD4+8+ from other samples to that number. Shown are the pooled results of two independent experiments, each with three to six replicates of identically treated stromal cells (the exact number is printed on each bar). Conditions: C57BL/6 stroma, white bars; B10.Br stroma, dark gray bars; B10.Br stroma plus G35 50 μg/ml, light gray bars; and B10.Br stroma plus D4 50 μg/ ml, hatched bars. Error bars represent 1 SD.
Figure 4
Figure 4
Inhibition of positive selection by G35 is specific for the MCC-I-Ek–restricted TCR. (A) Immature thymocytes from 5C.C7/B10.Br or A18/AKR/J TCR transgenic mice were cultured with thymic stromal cells from C57BL/6 (top) B10.Br (middle) or AKR/J (bottom) mice. Numbers on plots refer to the percentage of total live transgenic thymocytes that fall within each boxed population. (B) Analysis of the effects of G35 on production of CD4+ cells. The selection index was generated for each treatment group by computing the average percentage of CD4+8/CD4+8+ for untreated, I-Ek–positive stromal cells on each day and comparing the average percentage of CD4+8/CD4+8+ from other samples to that number. Shown are the pooled results of two independent experiments, each with three to six replicates of identically treated stromal cells (the exact number is printed on each bar). Conditions: C57BL/6 stroma, white bars; B10.Br stroma, dark gray bars; B10.Br stroma plus G35 50 μg/ml, light gray bars; and B10.Br stroma plus D4 50 μg/ ml, hatched bars. Error bars represent 1 SD.
Figure 5
Figure 5
G35 reactivity with thymus and peripheral lymphoid tissues. (A) Frozen sections of thymus (a–c), lymph node (d–f), and spleen (g–i) were labeled with 14.4.4S (a, d, g), G35 (b, e, h), D4 (c), or an irrelevant mAb (f, i). PC, T cell–dependent paracortical area; RP, red pulp and white pulp. Original magnification: a–i, ×45–55. (B) Ultrastructural analysis of G35 reactivity with thymus tissue. Labeling was associated with (a) cortical epithelium, (b) medullary epithelium (desmosome indicated by arrowhead, characteristic cystic structures indicated by asterisk), and (c) dendritic cells (characteristic bullate processes indicated by asterisks). Original magnification: a, ×8,400; b, ×4,950; c, ×8,050.
Figure 5
Figure 5
G35 reactivity with thymus and peripheral lymphoid tissues. (A) Frozen sections of thymus (a–c), lymph node (d–f), and spleen (g–i) were labeled with 14.4.4S (a, d, g), G35 (b, e, h), D4 (c), or an irrelevant mAb (f, i). PC, T cell–dependent paracortical area; RP, red pulp and white pulp. Original magnification: a–i, ×45–55. (B) Ultrastructural analysis of G35 reactivity with thymus tissue. Labeling was associated with (a) cortical epithelium, (b) medullary epithelium (desmosome indicated by arrowhead, characteristic cystic structures indicated by asterisk), and (c) dendritic cells (characteristic bullate processes indicated by asterisks). Original magnification: a, ×8,400; b, ×4,950; c, ×8,050.
Figure 6
Figure 6
G35 recognizes endogenous I-Ek–peptide complexes on a subset of thymic APCs. Levels of G35 expression on live, large CD314.4.4+ cells. (a) Cells from B10.Br (black line) or C57BL/6 (gray line) thymuses. (b) The staining of a stromal cell culture derived from B10.Br mice. (c) G35 expression on CH27 B cells pulsed overnight with 10 μM MCC 88–103 peptide (black line) or PBS (gray line). The percentage of cells with fluorescence greater than the intercept of the dashed lines was <2% in negative controls, 20% in a, 41% in b, and 97% in c.
Figure 7
Figure 7
Purification of thymic I-Ek peptide complexes. (A) Western blot of 12% acrylamide gel with polyclonal rabbit anti– I-Ek antisera. 1/60 of each fraction (denoted E1–5) from the first G35 column, the 14.4.4. column or the indicated amount of soluble I-Ek (sIEk) was run in each lane as noted on the figure. (B) HPLC chromatograms of the second fraction of the peptide eluates (in carrier solution) from the G35 or 14.4.4 columns, as noted. Carrier is 10 ng/ml leupeptin in 0.2 N acetic acid.
Figure 7
Figure 7
Purification of thymic I-Ek peptide complexes. (A) Western blot of 12% acrylamide gel with polyclonal rabbit anti– I-Ek antisera. 1/60 of each fraction (denoted E1–5) from the first G35 column, the 14.4.4. column or the indicated amount of soluble I-Ek (sIEk) was run in each lane as noted on the figure. (B) HPLC chromatograms of the second fraction of the peptide eluates (in carrier solution) from the G35 or 14.4.4 columns, as noted. Carrier is 10 ng/ml leupeptin in 0.2 N acetic acid.
Figure 8
Figure 8
G35 sensitivity to I-Ek bound to single substitution peptide variants. Each circle represents a different peptide; as keyed, the number on the left indicates the amino acid that was replaced and the letters indicate which amino acid was substituted in each position. Replacement amino acids are ordered by rough chemical similarity. Only residues that do not affect MHC binding were analyzed. (A) Recognition by mAb G35. Black circles represent from 81 to 100% of G35 reactivity to MCC–I-Ek complex activity and each shade of gray represents a 20% decrease in activity as calculated by estimating the concentration of G35 necessary to achieve the half maximal signal from the WT MCC–peptide complexes. (B) Interaction with 5C.C7 TCR. Gray circles represent peptides that produce detectable levels of IL-3 when used to stimulate a 5C.C7-bearing cell line as indicated. Hatched circles, peptides that antagonize the stimulation of the cell line by WT MCC peptide–I-Ek complexes; white circles, peptides that did not antagonize or stimulate the 5C.C7 cell line.

Similar articles

Cited by

References

    1. Sha WC, Nelson CA, Newberry RD, Kranz DM, Russell JH, Loh DY. Positive and negative selection of an antigen receptor on T cells in transgenic mice. Nature. 1988;336:73–76. - PubMed
    1. Kisielow P, Teh HS, Bluthmann H, von Boehmer H. Positive selection of antigen-specific T cells in thymus by restricting MHC molecules. Nature. 1988;335:730–723. - PubMed
    1. Berg LJ, Pullen AM, Fazekas de St B, Groth, Mathis D, Benoist C, Davis MM. Antigen/MHC-specific T cells are preferentially exported from the thymus in the presence of their MHC ligand. Cell. 1989;58:1035–1046. - PubMed
    1. Bevan MJ. In thymic selection, peptide diversity gives and takes away. Immunity. 1997;7:175–178. - PubMed
    1. Hogquist KA, Gavin MA, Bevan MJ. Positive selection of CD8+T cells induced by major histocompatibility complex binding peptides in fetal thymic organ culture. J Exp Med. 1993;177:1469–1473. - PMC - PubMed

Publication types

MeSH terms