. 1999 Jan 4;189(1):25-35.
doi: 10.1084/jem.189.1.25.

Immune adherence-mediated opsonophagocytosis: the mechanism of Leishmania infection

Affiliations

Immune adherence-mediated opsonophagocytosis: the mechanism of Leishmania infection

M Domínguez et al. J Exp Med. .

Abstract

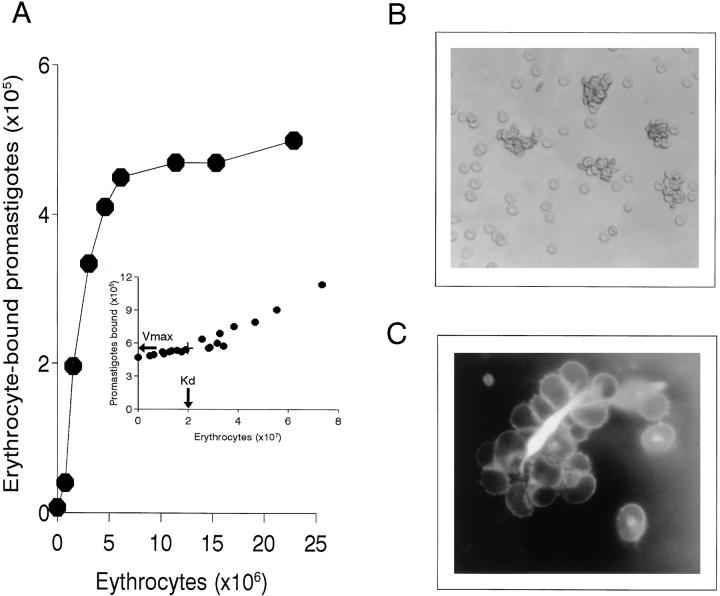
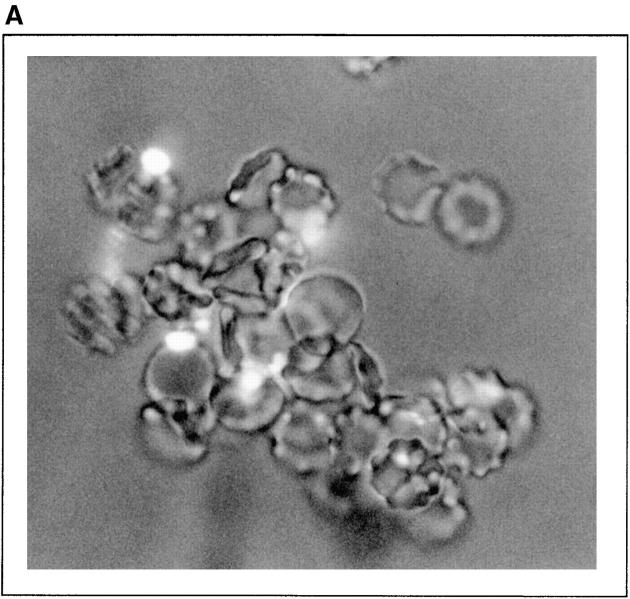
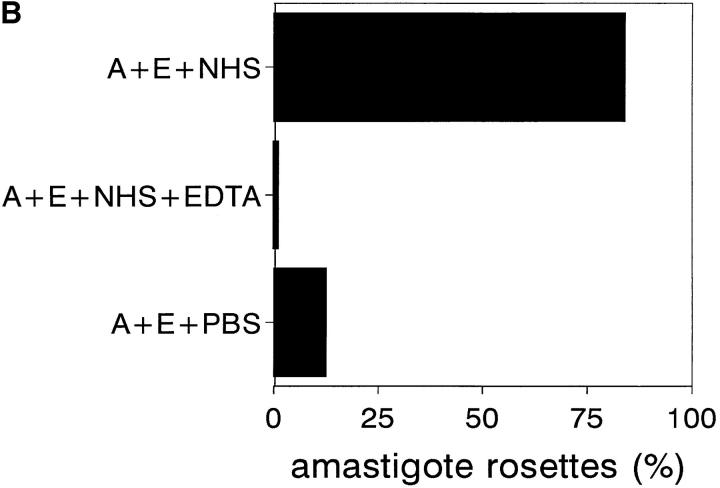
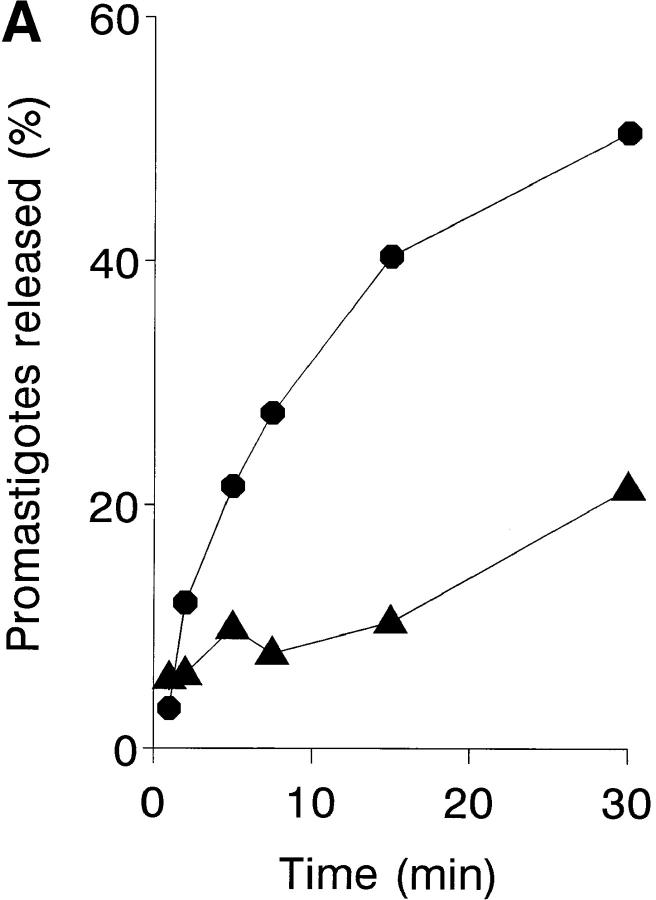
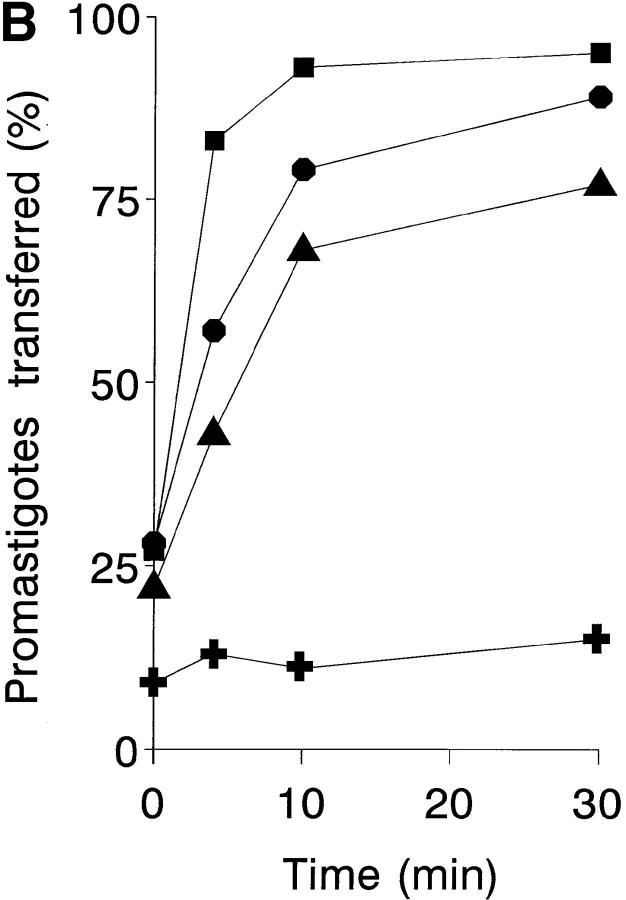
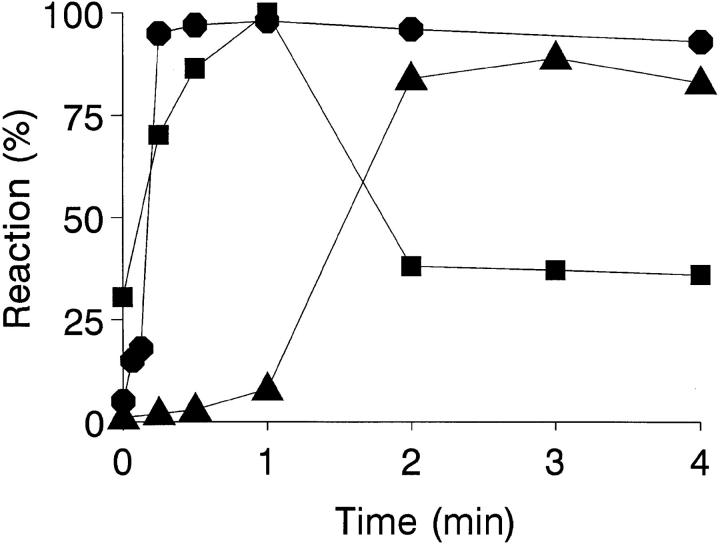
To mimic the sandfly pool feeding process and characterize the cellular and biochemical events that occur during the early stages of promastigote-host interaction, we developed an ex vivo model of human blood infection with Leishmania promastigotes. Within 30 s of blood contact, Leishmania promastigotes bind natural anti-Leishmania antibodies, which then activate the classical complement pathway and opsonization by the third component of complement. The opsonized promastigotes undergo an immune adherence reaction and bind quantitatively to erythrocyte CR1 receptors; opsonized Leishmania amastigotes also bind to erythrocytes. Progression of infection implies promastigote transfer from erythrocytes to acceptor blood leukocytes. After 10 min of ex vivo infection, 25% of all leukocytes contain intracellular parasites, indicating that blood cells are the early targets for the invading promastigotes. We propose that adaptation to the immune adherence mechanism aids Leishmania survival, promoting rapid promastigote phagocytosis by leukocytes. This facilitates host colonization and may represent the parasite's earliest survival strategy. In light of this mechanism, it is unlikely that infection-blocking vaccines can be developed.


Figures

Figure 1
Figure 1
Promastigote binding to human blood cell populations. 111In-labeled L. donovani promastigotes (5 × 10⁵ cells) were incubated at 37°C for 1 min with 100 μl of (A) heparinized blood; (B) blood supplemented with 10 mM EDTA; and (C) PBS. After incubation, the samples were centrifuged (500 g, 3 min, 20°C) through a discontinuous Percoll gradient. Three fractions (–3), one each from the buffer-Percoll interface (1); the 63–72% Percoll interface (2); and from the erythrocyte pellet (3) were collected, processed as described in Materials and Methods, and the percentage of [111In] cpm in each fraction determined. Data are the mean values of duplicate samples from a representative experiment of seven performed.
Figure 2
Figure 2
Kinetic and promastigote viability course of the IA reaction. 111In-labeled L. donovani promastigotes (5 × 10⁵ cells) were mixed with 100 μl of heparinized blood and incubated at 37°C for 0, 10, 20, 30, 60, 120, and 240 s. After incubation, the samples were centrifuged (500 g, 3 min, 20°C) through 72% Percoll. The Percoll solution (free parasites) and the erythrocyte pellet (erythrocyte-bound parasites) were collected separately, filtered, and the percentage of [111In] cpm retained was determined. Promastigote viability (▴) and erythrocyte-bound promastigote (•) profiles were calculated as described in Materials and Methods. Data are the mean value of duplicate samples from a representative experiment of three similar experiments performed.
Figure 3
Figure 3
Promastigote opsonization kinetics in NHS. (A) Promastigote complement activation pathway in NHS (closed symbols) and Mg-EGTA–treated NHS (open symbols). Duplicate aliquots (107 cells) of L. donovani (•, ○) and L. amazonensis (▴, ▵) promastigotes were incubated at 37°C in 25% NHS or 10 mM EGTA/7 mM Mg2Cl-treated 25% NHS, for 0, 0.25, 0.5, 1, 2, 3, 4, 5, 7.5, 10, and 15 min. Promastigotes were then washed twice by centrifugation (11,000 g, 1 min) in cold PFS and incubated 1 h on ice with mAb [125I]SIM 27-49. After incubation, promastigotes were washed twice (11,000 g, 1 min) and [125I]SIM 27-49 cpm determined. C3 deposition is expressed as a percentage of the point of maximum [125I]SIM 27-49 binding. Data are the mean value of duplicate samples taken from one representative experiment of three performed. (B) IgM binding kinetics to L. donovani and L. amazonensis promastigotes. Duplicate aliquots (107 cells) of L. donovani (•) and L. amazonensis (▴) promastigotes were incubated at 37°C in 25% NHS for 0, 0.25, 0.5, 1, 2, 3, 4, 5, 7, and 10 min. After reaction, promastigotes were washed three times (11,000 g, 1 min) with cold PFS and incubated for 1 h on ice with 125I-goat anti-μ antibody. Results are expressed as the percentage of IgM binding relative to the point of maximum binding. Each point value represents the mean of duplicate samples taken from a representative experiment of five performed.
Figure 3
Figure 3
Promastigote opsonization kinetics in NHS. (A) Promastigote complement activation pathway in NHS (closed symbols) and Mg-EGTA–treated NHS (open symbols). Duplicate aliquots (107 cells) of L. donovani (•, ○) and L. amazonensis (▴, ▵) promastigotes were incubated at 37°C in 25% NHS or 10 mM EGTA/7 mM Mg2Cl-treated 25% NHS, for 0, 0.25, 0.5, 1, 2, 3, 4, 5, 7.5, 10, and 15 min. Promastigotes were then washed twice by centrifugation (11,000 g, 1 min) in cold PFS and incubated 1 h on ice with mAb [125I]SIM 27-49. After incubation, promastigotes were washed twice (11,000 g, 1 min) and [125I]SIM 27-49 cpm determined. C3 deposition is expressed as a percentage of the point of maximum [125I]SIM 27-49 binding. Data are the mean value of duplicate samples taken from one representative experiment of three performed. (B) IgM binding kinetics to L. donovani and L. amazonensis promastigotes. Duplicate aliquots (107 cells) of L. donovani (•) and L. amazonensis (▴) promastigotes were incubated at 37°C in 25% NHS for 0, 0.25, 0.5, 1, 2, 3, 4, 5, 7, and 10 min. After reaction, promastigotes were washed three times (11,000 g, 1 min) with cold PFS and incubated for 1 h on ice with 125I-goat anti-μ antibody. Results are expressed as the percentage of IgM binding relative to the point of maximum binding. Each point value represents the mean of duplicate samples taken from a representative experiment of five performed.
Figure 4
Figure 4
Analysis of promastigote–erythrocyte interaction. (A) Dissociation (K d) constant measurement. 50 μl each of 33% NHS and 111In-labeled promastigotes (107 cells/ml) were mixed with 50 μl each of nine erythrocyte suspensions at concentrations ranging from 1 to 30% and incubated at 37°C for 3 min. After incubation, erythrocyte-bound promastigotes (•) were isolated by centrifugation (500 g, 3 min, 20°C) through 72% Percoll, and [111In] cpm determined. K d and V max values were obtained by direct linear plot as described in Materials and Methods. The inset shows the first quadrant of the plot, where the intersection points that allow K d and V max calculation are clustered. Data are shown from one of two similar experiments. (B) Microscopic analysis of the IA rosettes formed in normal human blood. Promastigote rosettes were formed by method A (Materials and Methods). A 5-μl aliquot was dispersed into 1 ml of PBS and IA rosettes examined under a bright-field inverted microscope (×280). (C) Detail of an AO-stained promastigote rosette. Rosettes were formed by method B (Materials and Methods), and stained with 1% AO diluted 1:50,000. A 10-μl aliquot was gently dispersed into 200 μl of PBS and the IA rosettes examined in an UV-fluorescence microscope (×1,350).
Figure 5
Figure 5
Amastigote IA. (A) AO-stained amastigote rosettes with human erythrocytes. Rosettes were formed as described in Materials and Methods. After incubation, samples were stained and photographed (×790). (B) Amastigote IA reaction. 50-μl aliquots each of a 10% washed erythrocyte suspension, L. amazonensis amastigotes (2 × 10⁷ cells/ml), and 33% NHS with or without 10 mM EDTA, or PBS as control, were incubated at 37°C for 3 min. After incubation, samples were AO-stained and amastigotes associated with two or more erythrocytes counted as IA rosettes. A, amastigotes; E, erythrocytes. Data are expressed as the mean values of duplicate samples. Similar results were obtained in two individual experiments.
Figure 5
Figure 5
Amastigote IA. (A) AO-stained amastigote rosettes with human erythrocytes. Rosettes were formed as described in Materials and Methods. After incubation, samples were stained and photographed (×790). (B) Amastigote IA reaction. 50-μl aliquots each of a 10% washed erythrocyte suspension, L. amazonensis amastigotes (2 × 10⁷ cells/ml), and 33% NHS with or without 10 mM EDTA, or PBS as control, were incubated at 37°C for 3 min. After incubation, samples were AO-stained and amastigotes associated with two or more erythrocytes counted as IA rosettes. A, amastigotes; E, erythrocytes. Data are expressed as the mean values of duplicate samples. Similar results were obtained in two individual experiments.
Figure 6
Figure 6
Promastigote transfer from IA rosettes to leukocyte acceptor cells. (A) Leukocyte-dependent IA rosette dissociation. For each time point, duplicate aliquots (50 μl) of normal and platelet- and leukocyte-depleted blood samples were incubated with 50 μl of 111In-labeled L. donovani promastigotes (5 × 10⁵ cells) and 50 μl of PBS, then incubated at 37°C for 1, 2, 5, 7.5, 15, and 30 min. After reaction, tube contents were loaded onto 72% Percoll and centrifuged (500 g, 5 min). Fractions containing the buffer-Percoll interface and the erythrocyte pellet were collected separately, filtered, and [111In] cpm determined. Percentage of IA rosettes dissociated in normal blood (•) and in the platelet- and leukocyte-depleted sample (▴). Background IA rosette dissociation after 1 min of incubation equals 4.5% of total [111In] cpm released. Data are expressed as the mean ± SEM of three experiments. (B) Promastigote acceptor capacity of blood cell populations. 111In-labeled promastigote transfer was analyzed in a two-step assay. Duplicate samples of IA rosettes, prepared by method B, were incubated at a 20:1 leukocyte/promastigote ratio with unfractionated leukocytes, PMN, MN, and PBS at 37°C for 0, 4, 10, and 30 min. After incubation, tube contents were loaded onto 72% Percoll and centrifuged (800 g, 3 min). Cells at the buffer-Percoll interface and the erythrocyte pellet were collected separately, filtered, and [111In] cpm determined. Acceptor cell populations: PMN (▪), unfractionated leukocytes (•), MN (▴), and PBS control (✚). Data are the mean value of duplicate samples from one representative experiment of four performed.
Figure 6
Figure 6
Promastigote transfer from IA rosettes to leukocyte acceptor cells. (A) Leukocyte-dependent IA rosette dissociation. For each time point, duplicate aliquots (50 μl) of normal and platelet- and leukocyte-depleted blood samples were incubated with 50 μl of 111In-labeled L. donovani promastigotes (5 × 10⁵ cells) and 50 μl of PBS, then incubated at 37°C for 1, 2, 5, 7.5, 15, and 30 min. After reaction, tube contents were loaded onto 72% Percoll and centrifuged (500 g, 5 min). Fractions containing the buffer-Percoll interface and the erythrocyte pellet were collected separately, filtered, and [111In] cpm determined. Percentage of IA rosettes dissociated in normal blood (•) and in the platelet- and leukocyte-depleted sample (▴). Background IA rosette dissociation after 1 min of incubation equals 4.5% of total [111In] cpm released. Data are expressed as the mean ± SEM of three experiments. (B) Promastigote acceptor capacity of blood cell populations. 111In-labeled promastigote transfer was analyzed in a two-step assay. Duplicate samples of IA rosettes, prepared by method B, were incubated at a 20:1 leukocyte/promastigote ratio with unfractionated leukocytes, PMN, MN, and PBS at 37°C for 0, 4, 10, and 30 min. After incubation, tube contents were loaded onto 72% Percoll and centrifuged (800 g, 3 min). Cells at the buffer-Percoll interface and the erythrocyte pellet were collected separately, filtered, and [111In] cpm determined. Acceptor cell populations: PMN (▪), unfractionated leukocytes (•), MN (▴), and PBS control (✚). Data are the mean value of duplicate samples from one representative experiment of four performed.
Figure 7
Figure 7
Kinetic profile of Leishmania IA reaction. The time course of the opsonizing reactions involved in the Leishmania IA mechanism. IgM binding (▪), C3 deposition (▴), and the promastigote–erythrocyte interaction (•) are taken from Fig. 3, B and A, and Fig. 2, respectively. Data are expressed as a percentage of the point of maximum reaction.

Similar articles

Cited by

References

    1. Ribeiro JMC. Blood-feeding arthropods: live syringes or invertebrate pharmacologists? . Infect Agents Dis. 1995;4:143–152. - PubMed
    1. Mosser DM, Rosenthal LA. Leishmania–macrophage interactions: multiple receptors, multiple ligands and diverse cellular responses. Semin Cell Biol. 1993;4:315–322. - PubMed
    1. Brittingham A, Mosser DM. Exploitation of the complement system by Leishmaniapromastigotes. Parasitol Today. 1996;12:444–447. - PubMed
    1. Wright SD, Silverstein SC. Receptors for C3b and C3bi promote phagocytosis but not the release of toxic oxygen from human phagocytes. J Exp Med. 1983;158:2016–2023. - PMC - PubMed
    1. Hill JO. Pathophysiology of experimental leishmaniasis: pattern of development of metastatic disease in the susceptible host. Infect Immun. 1986;52:364–369. - PMC - PubMed

Publication types