. 1999 Jan 4;189(1):169-78.
doi: 10.1084/jem.189.1.169.

DNA vaccination: transfection and activation of dendritic cells as key events for immunity

Affiliations

DNA vaccination: transfection and activation of dendritic cells as key events for immunity

O Akbari et al. J Exp Med. .

Abstract

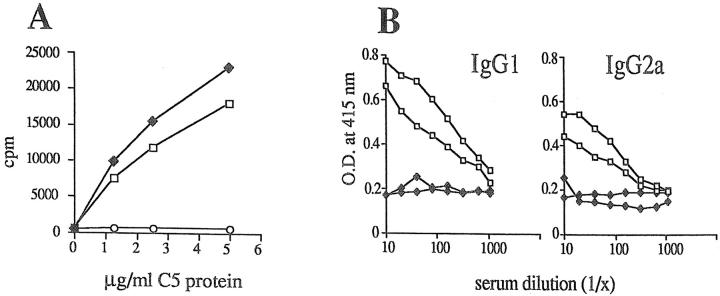
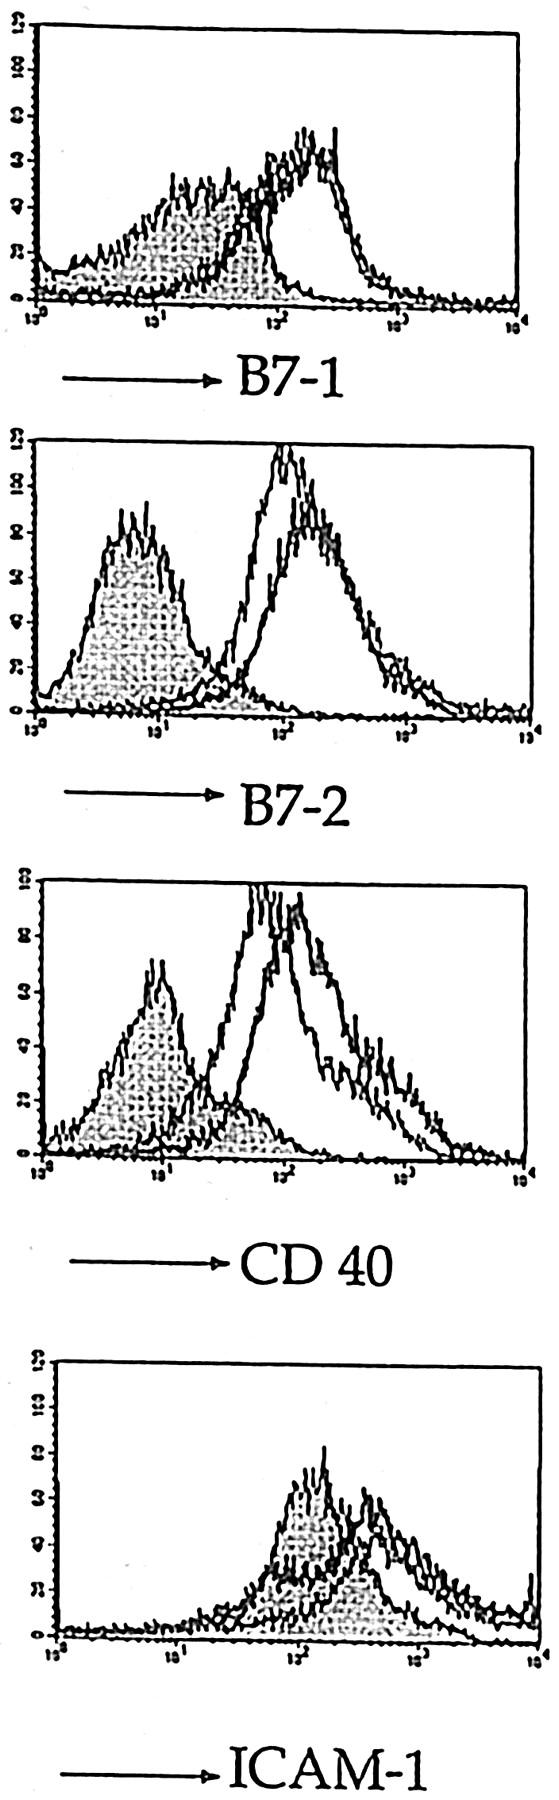
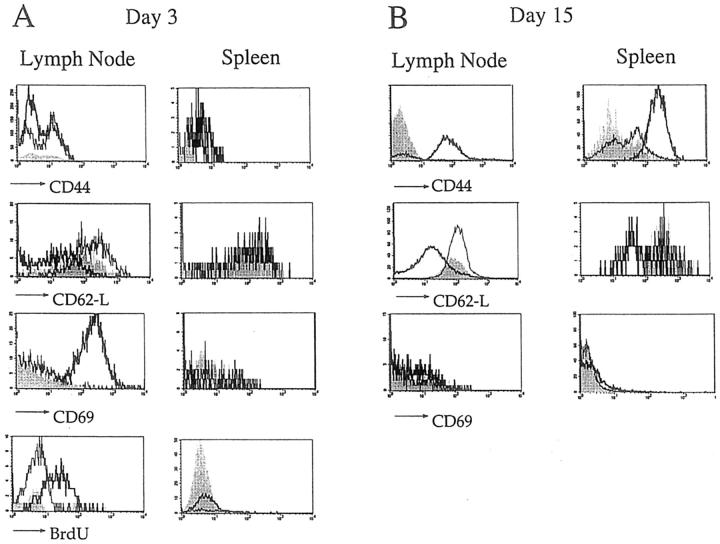
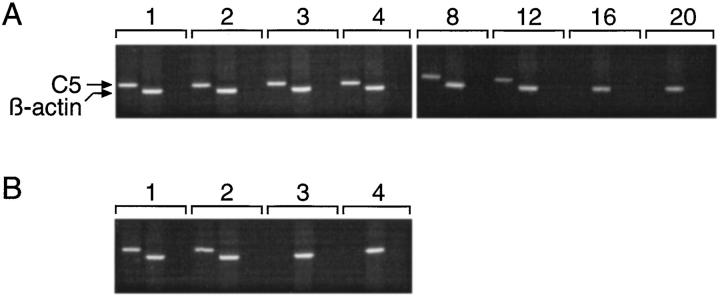
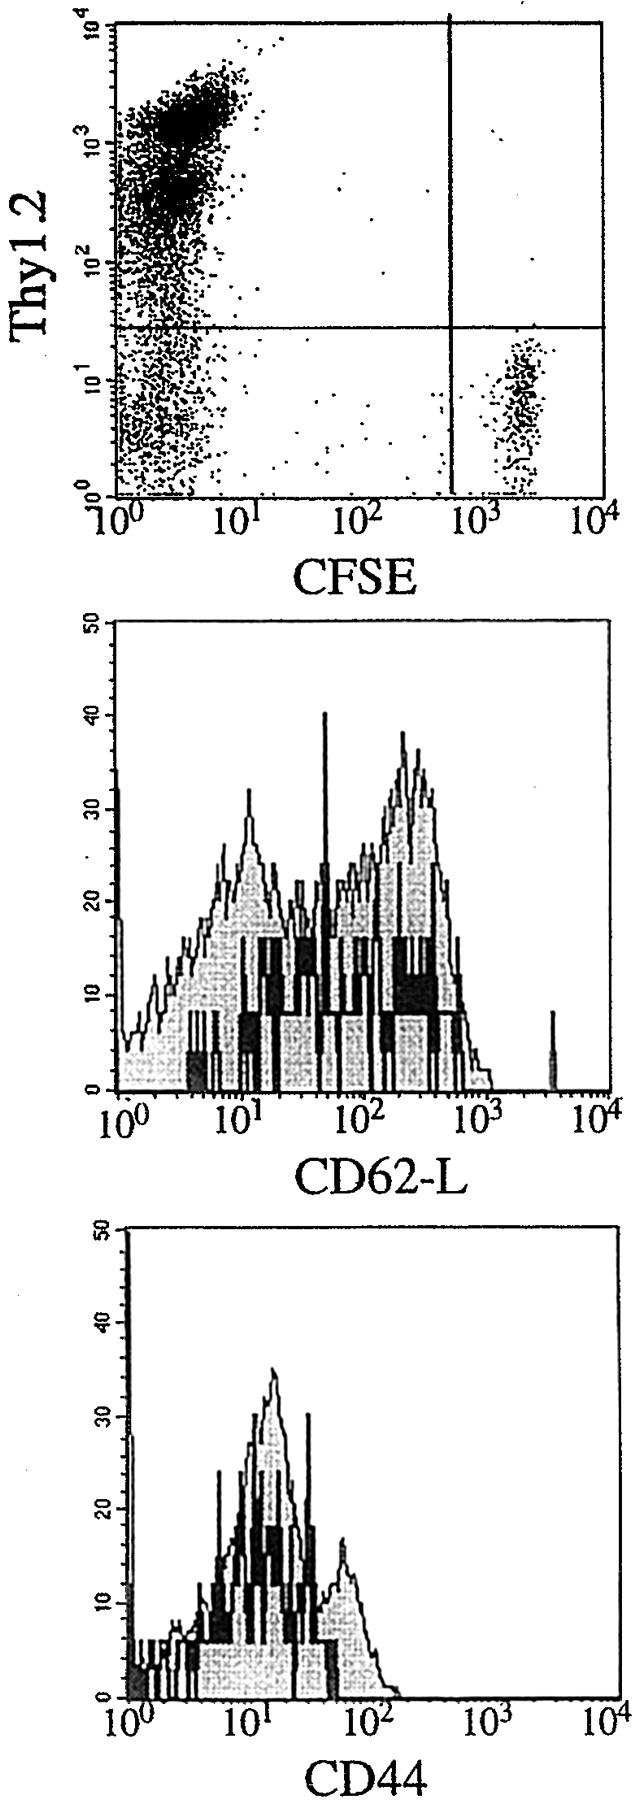
The mechanisms underlying initiation and maintenance of CD4 T cell responses after DNA vaccination were studied using a construct coding for nonsecreted fifth component of complement (C5) protein, thus restricting the availability of antigen. The only cell types to express C5 were keratinocytes at the site of DNA application and a small number of dendritic cells present in the draining lymph nodes. Antigen expression persisted for up to 12 wk in keratinocytes, but dendritic cells did not express C5 beyond 2 wk after vaccination. Cross-priming of dendritic cells by C5 expressed in keratinocytes did not occur unless keratinocyte death was induced by irradiation in vitro. CD4 T cells were activated in the draining lymph nodes only and subsequently migrated to the spleen, where memory T cells persisted for longer than 40 wk despite the absence of a source of persistent antigen. While DNA vaccination resulted in transfection of a small proportion of dendritic cells only, it led to general activation of all dendritic cells, thus providing optimal conditions for effective T cell activation and maintenance of memory.


Figures

Figure 2
Figure 2
(A) RT-PCR was performed for C5 and β-actin for each sample, as indicated on top. The panel on the left shows RT-PCR from cells of 5.4- vaccinated mice. NDC-DC depleted lymph node cells. On the right RT-PCR from DC of control vector–vaccinated mice and from keratinocytes of 5.4-vaccinated mice are shown. (B and C) Quantitative PCR for the presence of C5 cDNA in (B) lymph nodes and (C) spleen of 5.4-vaccinated mice. The number of PCR cycles is indicated below each lane. (D) Confocal image of two DC isolated from draining lymph nodes of 5.4-vaccinated mice. N418 expression is in red, green fluorescence (GFP) shows the presence of the vaccination construct. Bright field image is overlaid to illustrate the dendritic shape of the cells. (E) IL-2 production obtained with 2 × 10⁴/well DC isolated from draining lymph nodes of vaccinated mice determined by comparison with a standard curve. The standard curve was set up by culturing mixtures of untreated and C5-pulsed (and extensively washed) bone marrow–derived DC with A18 hybridoma cells. The ratio of unpulsed/pulsed DC is shown on the abscissa, and the counts obtained by coculture of A18 hybridoma cells and DC from vaccinated mice intersects the standard curve at a ratio of 98 unpulsed to 2 pulsed DC. (F) IL-2 production by A18 hybridoma cells cultured with serially titrated numbers of DC which were either pulsed with 5 μg/ml C5 (---○---) or cocultured with untreated keratinocytes (□) or with 1,000 Rad irradiated keratinocytes (⋄).
Figure 2
Figure 2
(A) RT-PCR was performed for C5 and β-actin for each sample, as indicated on top. The panel on the left shows RT-PCR from cells of 5.4- vaccinated mice. NDC-DC depleted lymph node cells. On the right RT-PCR from DC of control vector–vaccinated mice and from keratinocytes of 5.4-vaccinated mice are shown. (B and C) Quantitative PCR for the presence of C5 cDNA in (B) lymph nodes and (C) spleen of 5.4-vaccinated mice. The number of PCR cycles is indicated below each lane. (D) Confocal image of two DC isolated from draining lymph nodes of 5.4-vaccinated mice. N418 expression is in red, green fluorescence (GFP) shows the presence of the vaccination construct. Bright field image is overlaid to illustrate the dendritic shape of the cells. (E) IL-2 production obtained with 2 × 10⁴/well DC isolated from draining lymph nodes of vaccinated mice determined by comparison with a standard curve. The standard curve was set up by culturing mixtures of untreated and C5-pulsed (and extensively washed) bone marrow–derived DC with A18 hybridoma cells. The ratio of unpulsed/pulsed DC is shown on the abscissa, and the counts obtained by coculture of A18 hybridoma cells and DC from vaccinated mice intersects the standard curve at a ratio of 98 unpulsed to 2 pulsed DC. (F) IL-2 production by A18 hybridoma cells cultured with serially titrated numbers of DC which were either pulsed with 5 μg/ml C5 (---○---) or cocultured with untreated keratinocytes (□) or with 1,000 Rad irradiated keratinocytes (⋄).
Figure 1
Figure 1
(A) IL-2 production of cells from draining lymph nodes of 5.4-vaccinated (150 μg/mouse, ♦), control vector– vaccinated (○), or protein- immunized (10 μg in CFA, □) mice. Lymph nodes from two mice per group were pooled. The figure shows proliferation of IL-2–dependent CTLL cells. (B) Two 5.4-vaccinated (♦) and two C5 protein–immunized (□) mice were revaccinated or reinjected with 10 μg C5 protein/ CFA, respectively, 3 wk after the first injection. 9 d later their sera were tested for the presence of IgG1 and IgG2a anti-C5 antibodies by ELISA.
Figure 3
Figure 3
FACS® analysis of DC isolated 3 d after vaccination by magnetic cell sorting from draining lymph nodes of 5.4-vaccinated (thick lines), vector-vaccinated (thin lines), and untreated mice (shaded histograms). The figure shows expression of activation markers B7.1, B7.2, CD40, and ICAM-1 on gated N418 positive DC.
Figure 4
Figure 4
Lymph node and spleen cells from A18 TCRtg mice vaccinated with the 5.4 construct, (thick lines), the control vector (thin lines), or untreated (shaded histograms) were analyzed (A) 3 d and (B) 15 d later by three-color FACS® analysis. The figure shows expression of CD44, CD62-L and CD69 (and BrdU labeling for day 3 after vaccination) on gated CD4 and Vβ8.3-positive T cells.
Figure 5
Figure 5
RT-PCR analysis was performed for keratinocytes from (A) 5.4-vaccinated mice and (B) DC isolated from draining lymph nodes of 5.4-vaccinated mice by magnetic cell sorting. RT-PCR was performed for C5 and β-actin at different time points after vaccination, as indicated on top (week 1 to week 20). The third lane for each time point is a control showing the absence of DNA contamination in the RNA samples (omission of RT before the PCR reaction).
Figure 6
Figure 6
Three-color FACS® analysis of cells from draining lymph nodes (pooled from two mice vaccinated with 5.4 20 d before i.v. injection with 106 CFSE-labeled naive Thy1.1 A18 TCRtg T cells). 7 d after injection of naive T cells, lymph node cells were analyzed by FACS® for expression of CFSE, Thy1.2, Thy1.1, and activation markers. The dot plot shows CFSE levels on Thy1.2 negative (Thy1.1 positive) injected T cells. Histograms for the activation markers CD44 and CD62-l show cells gated for expression of Thy1.1 (black lines) or Thy1.2 (endogenous T cells; shaded histograms).

Similar articles

Cited by

References

    1. Donnelly JJ, Ulmer B, Shiver JW, Liu MA. DNA vaccines. Annu Rev Immunol. 1997;15:617–648. - PubMed
    1. Raz E, Carson DE, Parker SE, Parr TB, Abai AM, Aichinger G, Gromkowski SH, Singh M, Lew D, Yankauckas MA, et al. Intradermal gene immunization: the possible role of DNA uptake in the induction of cellular immunity to viruses. Proc Natl Acad Sci USA. 1994;91:9519–9523. - PMC - PubMed
    1. Wolff JA, Malone RW, Williams P, Chong W, Acsadi G, Jani A, Felgner PL. Direct gene transfer into mouse muscle in vivo. Science. 1990;247:1465–1468. - PubMed
    1. Casares S, Inaba K, Brumeanu T-D, Steinman RM, Bona CA. Antigen presentation by dendritic cells after immunization with DNA encoding a major histocompatibility complex class II–restricted viral epitope. J Exp Med. 1997;186:1481–1486. - PMC - PubMed
    1. Condon C, Watkins SC, Celluzzi CM, Thompson K, Falo LD. DNA-based immunization by in vivo transfection of dendritic cells. Nat Med. 1996;2:1122–1128. - PubMed