. 1999 Jan;113(1):125-38.
doi: 10.1085/jgp.113.1.125.

P2 receptor modulation of voltage-gated potassium currents in Brown adipocytes

Affiliations

P2 receptor modulation of voltage-gated potassium currents in Brown adipocytes

S M Wilson et al. J Gen Physiol. 1999 Jan.

Abstract

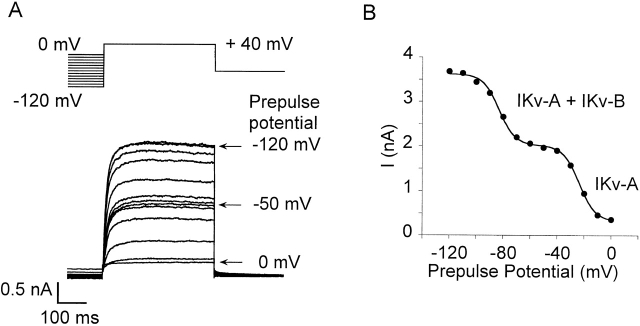
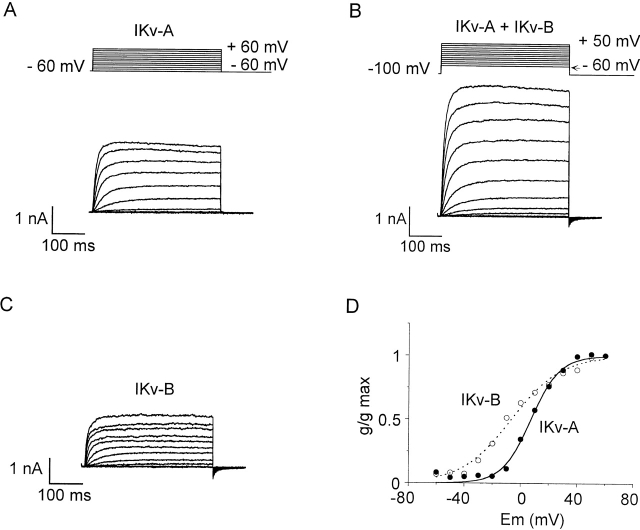
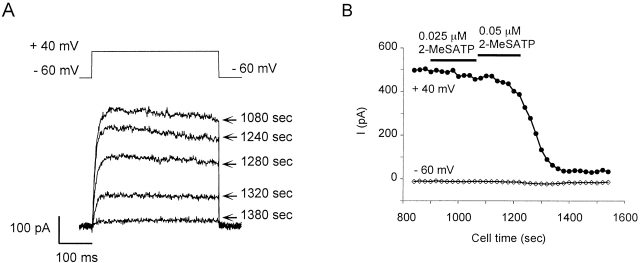
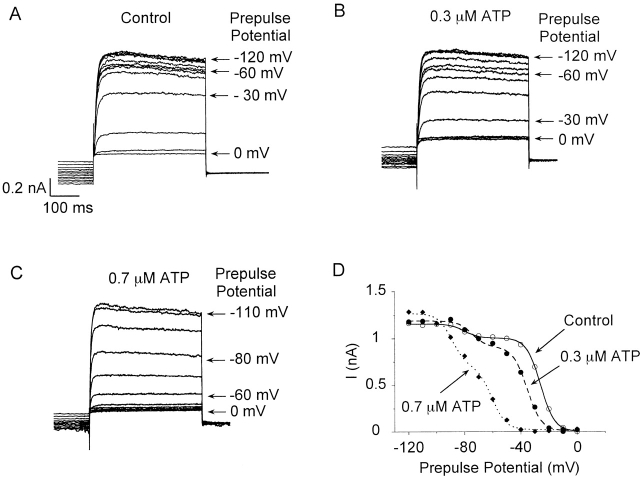
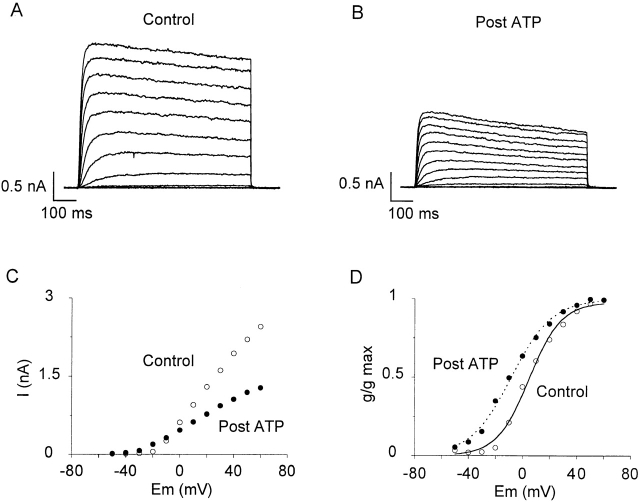
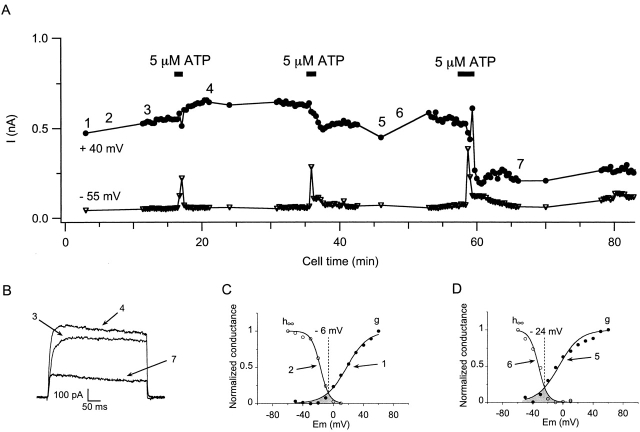
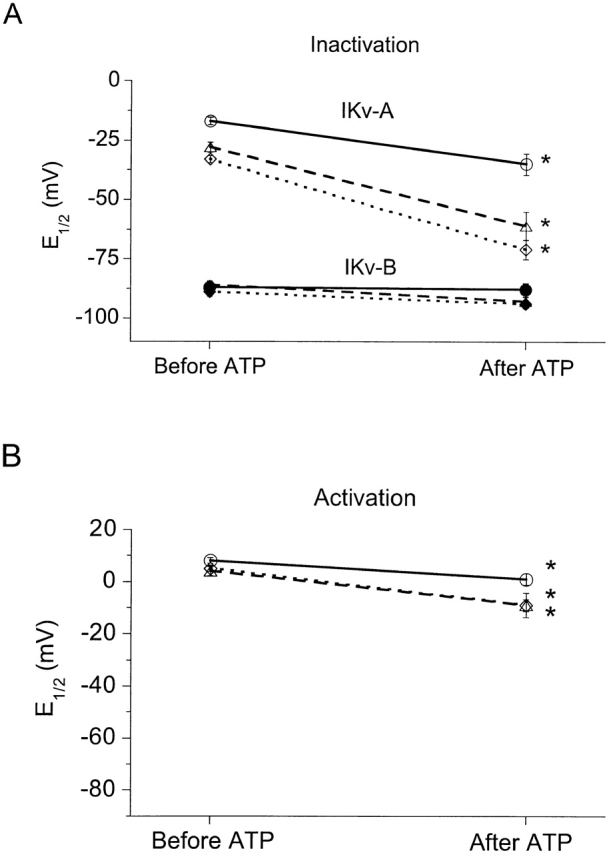
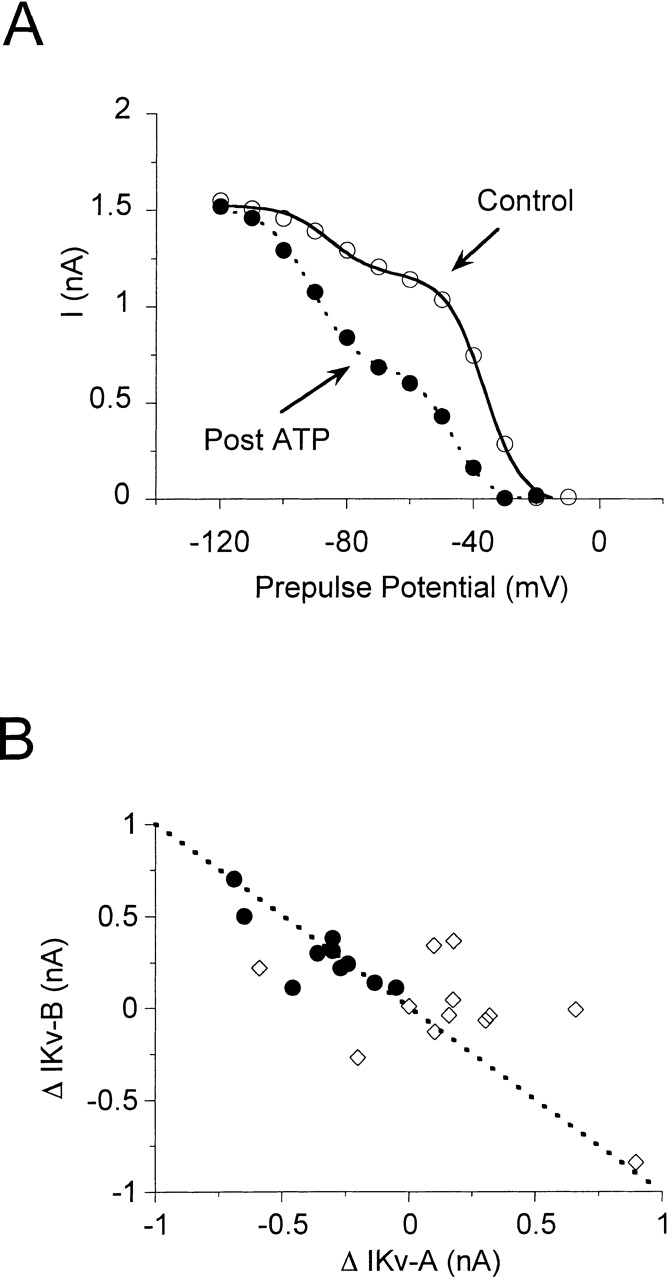
Using patch voltage-clamp techniques, we find there are two components to the voltage-gated potassium current (IKv) in rat brown adipocytes. The components differ in their gating and responses to purinergic stimulation, but not their pharmacology. IKv-A recovers from inactivation at physiological membrane potentials, while IKv-B inactivation recovers at more negative potentials. Both currents are >90% blocked by similar concentrations of quinine and tetraethylammonium, but not by beta-dendrotoxin, charybdotoxin, or apamin. The two current components are differentially modulated by extracellular ATP. ATP shifts the voltage dependence of IKv-A inactivation negative by 38 +/- 5 mV (n = 35, +/-SEM) and shifts activation by -14 +/- 2 mV in whole-cell experiments. ATP did not affect the steady state inactivation voltage dependence of IKv-B, but did apparently convert IKv-A into IKv-B. The pharmacology of the inactivation shift is consistent with mediation by a P2 purinergic receptor. Purinergic stimulation of perforated-patch clamped cells causes hyperpolarizing shifts in the window current of IKv-A by shifting inactivation -18 +/- 4 mV and activation -7 +/- 2 mV (n = 16). Since perforated-patch recordings will most closely resemble in vivo cell responses, this ATP-induced shift in the window current may facilitate IKv activation when the cell depolarizes. IKv activity is necessary for the proliferation and differentiation of brown adipocytes in culture (Pappone, P.A., and S.I. Ortiz-Miranda. 1993. Am. J. Physiol. 264:C1014-C1019) so purinergic modulation of IKv may be important in altering adipocyte growth and development.


Figures

Figure 1
Figure 1
IKv can be divided into two components based on the voltage dependence of inactivation. (A) Currents used to measure steady state inactivation. IKv was measured during 400-ms test pulses to +40 mV after 3-s prepulses from 0 to −120 mV in 10-mV increments, applied every 20 s, from −60 mV. (B) Peak current amplitude during the test pulse at each prepulse potential for the same cell. The curve is the sum of two Boltzmann relations (Eq. 2) fit to the data. IKv-A E 1/2 = −23 mV, and IKv-B E 1/2 = −83 mV. k = −6 mV for both current components. IKv-B is 53% of the total IKv.
Figure 2
Figure 2
Activation of IKv-A and IKv-B. (A) IKv-A currents in isolation. Currents were recorded every 5 s during 400-ms depolarizations from −60 to +60 mV in 10-mV increments from −60 mV. The potential was returned to −60 mV after each test pulse. Linear currents were subtracted using a P/4 protocol. (B) Currents from the same cell recorded during depolarizations after a 3-s conditioning pulse to −100 mV applied every 15 s. The potential returned to −100 mV for 100 ms after each test pulse. (C) IKv-B currents isolated by subtracting the currents in A from those in B. (D) Normalized conductance– voltage relations determined from these records for IKv-A (•) and IKv-B (○). For IKv-A (solid line), E 1/2 = 7 mV, k = 10 mV; for IKv-B (dashed line), E 1/2 = −7 mV, k = 18 mV (Eq. 1). For this cell, G max = 20 nS for IKv-A and 15 nS for IKv-B.
Figure 3
Figure 3
P2 receptor agonist exposure decreases IKv in a whole-cell experiment. (A) IKv-A currents recorded during depolarizations to +40 mV from the −60-mV HP at the cell times indicated. 0.05 μM 2-MeSATP was added at 1,080 s to the bathing solution. (B) Peak IKv-A at +40 mV (•) and holding current at −60 mV (⋄) amplitudes measured every 20 s. 0.025 or 0.05 μM 2-MeSATP was present during the times shown by the bars. Linear currents were subtracted from the +40-mV records using a P/4 protocol. The pipette contained a solution with K-aspartate with ≈18 nM Ca2+.
Figure 4
Figure 4
ATP induces hyperpolarizing shifts in the voltage dependence of inactivation in a whole-cell recording. (A) Currents used to measure steady state inactivation before ATP. The currents were measured as described in Fig. 1. (B) Currents measured with the same protocol after 11 min of exposure to 0.3 μM ATP. (C) Currents after a 10 min exposure to 0.7 μM ATP. (D) Peak current amplitudes versus prepulse potential before (○), after 0.3 μM ATP (•), and 0.7 μM ATP (♦) in this cell. Smooth curves are the sum of two Boltzmann relations (Eq. 2). Before ATP (solid line), IKv-A E 1/2 = −26 mV and IKv-B E 1/2 = −81 mV. After 0.3 μM ATP (dashed line), IKv-A E 1/2 = −36 mV and IKv-B E 1/2 = −76 mV. After 0.7 μM ATP (dotted line), IKv-A E 1/2 = −61 mV and IKv-B E 1/2 = −89 mV. k was fixed at −5 mV throughout. This pipette solution contained K-aspartate, 1 mM ATP, and ≈18 nM Ca2+.
Figure 5
Figure 5
ATP shifts IKv-A activation voltage dependence in a whole-cell recording. (A) IKv-A currents before ATP. Leak subtracted currents were recorded every 5 s during 400-ms voltage steps from −50 to +60 mV in 10-mV increments, applied from the −60-mV HP. (B) Currents after a 10-min exposure to 0.02 μM ATP in the same cell. (C) Peak current–voltage relationship for IKv-A before (○) and after (•) ATP. Threshold for IKv-A activation was −20 mV before and −30 mV after ATP. IKv-A amplitude at +60 mV decreased ≈50% after ATP. (D) Normalized conductance–voltage relationship before (○) and after (•) ATP in this cell. Boltzmann relations (Eq. 1) fit to the data gave IKv-A E 1/2 = +5 mV, k = 12 mV before ATP (solid line) and IKv-A E 1/2 = −8 mV, k = 15 mV after ATP (dotted line). The pipette contained a solution with K-aspartate with ≈100 nM Ca2+.
Figure 6
Figure 6
Effects of ATP on IKv-A in a perforated-patch recording. (A) Peak IKv-A (•) measured during depolarizations to +40 mV from the −60-mV holding potential, and linear leak current (▿) amplitudes measured during P/4 depolarizations to −55 mV from the −80-mV leak holding potential. 5 μM ATP was present during the times shown by the bars. Numbered time points 3 (control), 4, and 7 (after ATP) correspond to current traces in B, 1 and 2 to control normalized conductance–voltage measurements shown in C, and 5 and 6 to the conductance–voltage relations after ATP shown in D. (B) IKv-A measured at the times shown in A. 3 indicates control, 4 and 7 are after one and three exposures to ATP. (C) Normalized activation (g) and steady state inactivation (h) conductance–voltage relations before ATP. Boltzmann relations (Eq. 1) fitted to the data collected at the times indicated in A. Before ATP activation E 1/2 = 18 mV, and steady state inactivation E 1/2 = −17 mV. (D) Normalized activation (g) and steady state inactivation (h) conductance–voltage relations after ATP. Boltzmann relations (Eq. 1) gave activation E 1/2 = −5 mV and steady state inactivation E 1/2 = −32 mV. k was fixed at 6 mV for activation and for steady state inactivation was fixed at −14 mV. Shaded areas in C and D show voltage range for steady state IKv-A (window current). Dashed line shows potential of the peak window current in C and D, which shifted 18 mV negative after ATP.
Figure 7
Figure 7
ATP affects IKv-A activation and inactivation in whole-cell and perforated-patch clamp experiments. (A) Effects of ATP on E 1/2 for IKv-A and IKv-B steady state inactivation. Average E 1/2s for steady state inactivation are shown for IKv-A (open symbols) and IKv-B (filled symbols) from 16 perforated-patch (circles), 35 whole-cell nucleotide free (diamonds), and 23 whole-cell with internal MgATP (triangles) experiments before and after ATP. (B) Effects of ATP on E 1/2 for IKv-A activation. Shown is the average E 1/2 for activation from 16 perforated-patch (○), 35 whole-cell nucleotide free (⋄), and 16 whole-cell with internal MgATP (▵) experiments before and after ATP. Error bars represent ±SEM. For some conditions, the error is smaller than the symbol. *Significant difference between control and ATP-exposed conditions based on a paired t test (P < 0.05).
Figure 8
Figure 8
ATP may convert IKv-A into IKv-B. (A) Steady state inactivation before (○) and after (•) exposure to 350 nM ATP in a whole-cell experiment. Curves are the sum of two Boltzmann relations (Eq. 2) fit to the data. Before ATP (solid line), I max for IKv-A was 1,200 pA and for IKv-B was 360 pA. IKv-A E 1/2 = −36 mV and IKv-B E 1/2 = −85 mV, k = −6 mV for both components. After ATP (dotted line), I max for IKv-A was 680 pA and for IKv-B was 840 pA. IKv-A E 1/2 = −47 mV and IKv-B E 1/2 = −91 mV, k = −6 mV for both current components. (B) Correlation between ATP induced IKv-A decrease and IKv-B increase in whole-cell (•) and perforated-patch (⋄) experiments. The dashed line shows the relation expected if the decrease in IKv-A was equal to the increase in IKv-B. Only those cells that had two clearly identifiable current components after ATP were chosen for analysis.

References

    1. Abraham EH, Prat AG, Gerweck L, Seneveratne T, Arceci RJ, Kramer R, Guidotti G, Cantiello HF. The multidrug resistance (mdr1) gene product functions as an ATP channel. Proc Natl Acad Sci USA. 1993;90:312–316. - PMC - PubMed
    1. Armstrong CM, Bezanilla F. Charge movement associated with the opening and closing of the activation gates of the Na channels. J Gen Physiol. 1974;63:533–552. - PMC - PubMed
    1. Barnard EA, Simon J, Webb TE. Nucleotide receptors in the nervous system: an abundant component using diverse transduction mechanisms. Mol Neurobiol. 1997;15:103–129. - PubMed
    1. Barsoum M, Wilson S, Wilson B, Pappone P. Purine nucleotides modulate pre-brown adipocyte proliferation. FASEB J. 1998;12:A636. . (Abstr.) - PMC - PubMed
    1. Bean BP. Pharmacology and electrophysiology of ATP-activated ion channels. Trends Pharmacol Sci. 1992;13:87–90. - PubMed

Publication types

Substances