

Review
doi: 10.1021/js9801485.
Pharmacokinetic and metabolism studies using microdialysis sampling
Affiliations
- PMID: 9874697
- PMCID: PMC2519818
- DOI: 10.1021/js9801485
Item in Clipboard
Review
Pharmacokinetic and metabolism studies using microdialysis sampling
J Pharm Sci.
1999 Jan.
No abstract available
Figures
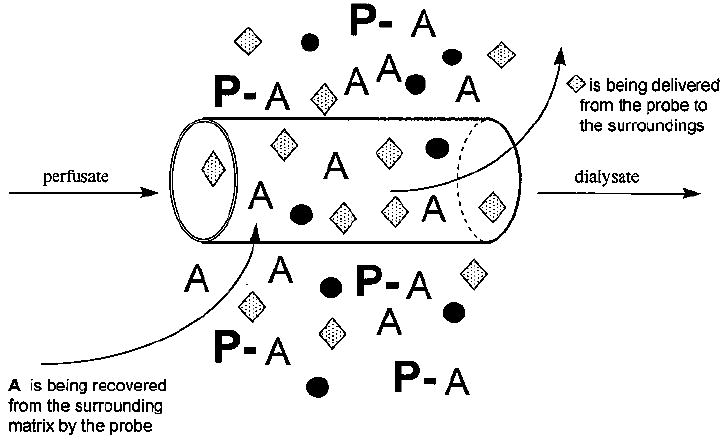
The microdialysis process.
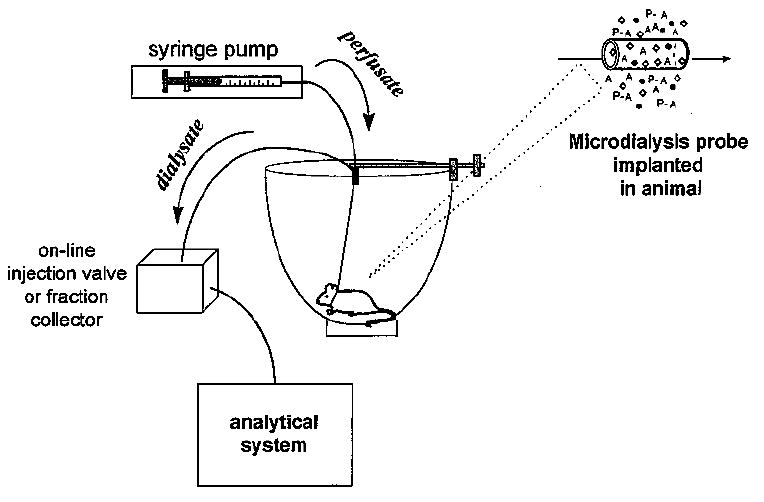
General diagram of microdialysis system for sampling from an awake, freely moving animal. The analysis may be performed on a variety of analytical systems, and coupling between the analytical and microdialysis systems may be on- or off-line.
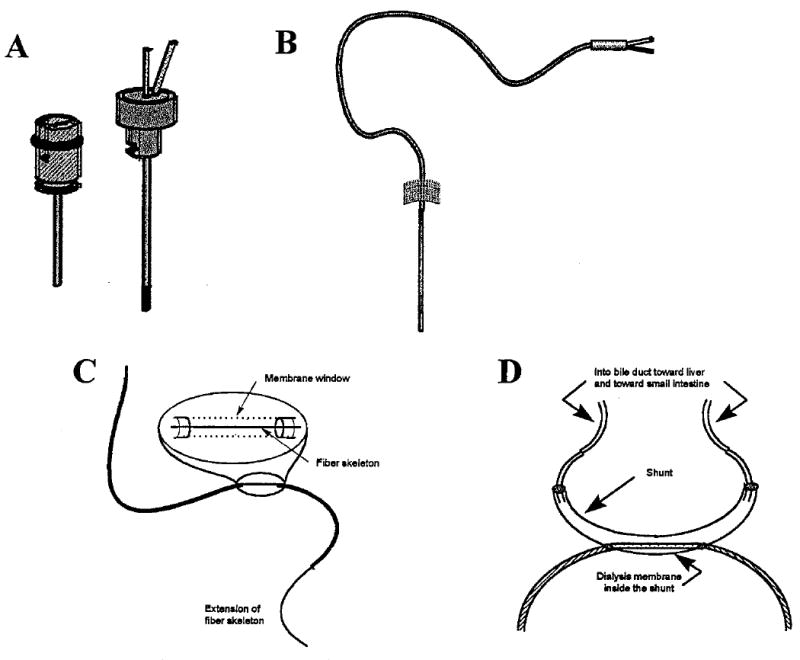
Microdialysis probe geometries (probes not drawn to scale). A. Intracerebral guide cannula and pin-style brain probe. B. Flexible probe for intravenous use. C. Linear probe for peripheral tissues. D. Shunt probe designed for sampling from bile duct of rat. (Used with permission of Bioanalytical Systems, Inc., West Lafayette, IN.)
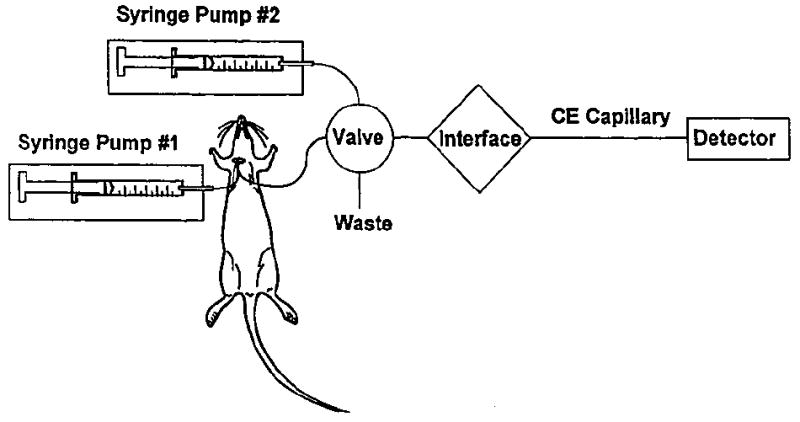
Schematic of the on-line microdialysis/capillary electrophoresis system used for the analysis of SR4233.
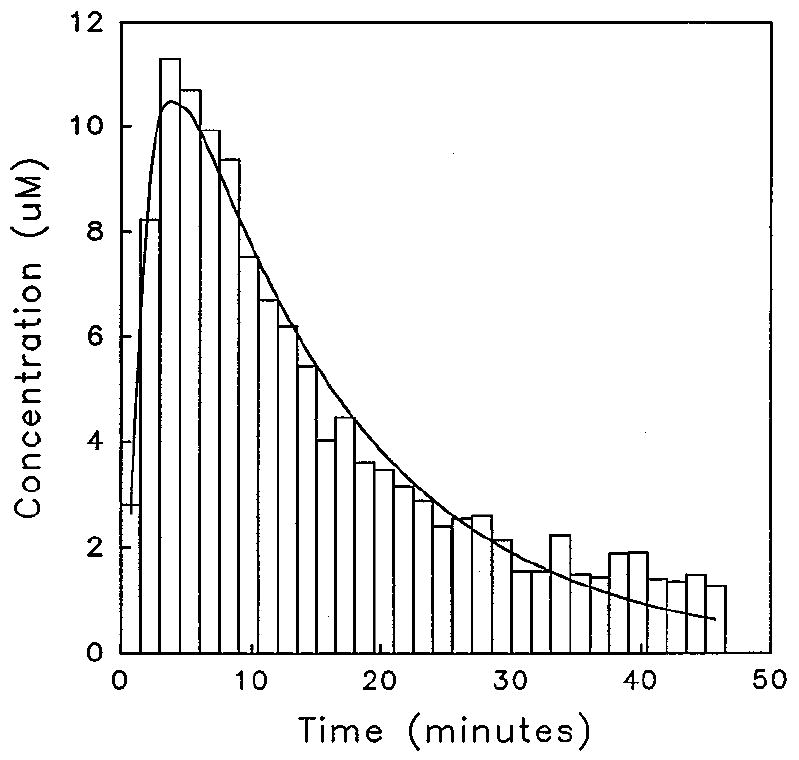
Pharmacokinetic curve following a 4-mg/kg ip dose of SR4233 obtained using an on-line microdialysis/capillary electrophoresis system.
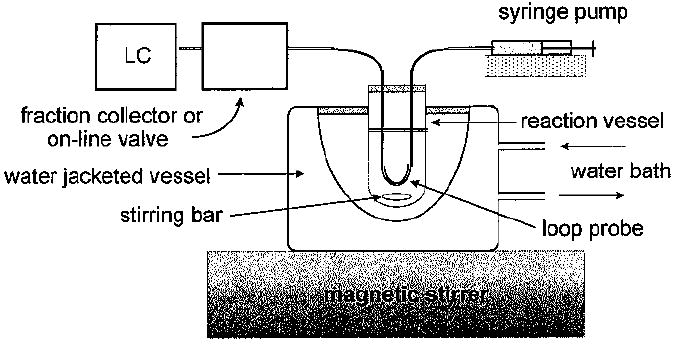
In vitro microdialysis sampling system for microsome or similar incubation process.
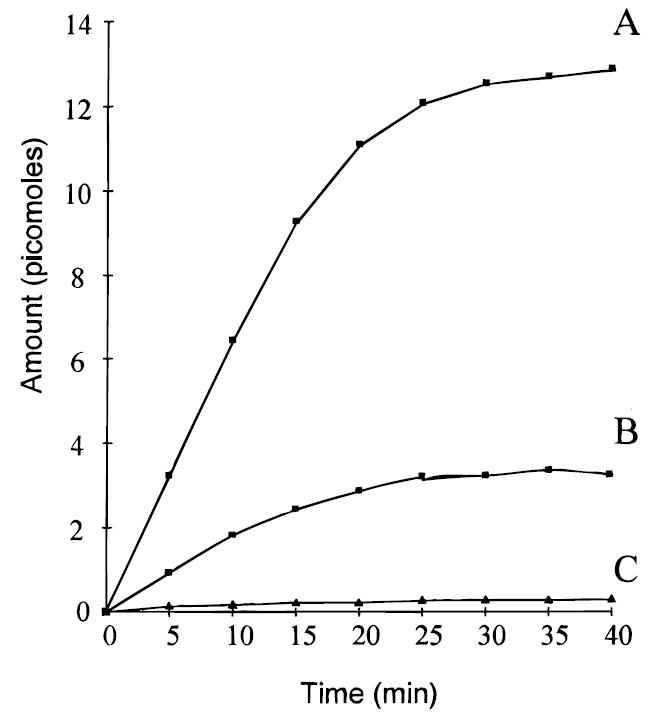
Metabolic profiles of diazapam metabolites sampled by microdialysis from liver microsome incubation mixture. Diazepam concentration was 145 M: (A) temazepam; (B) N-desmethyldiazepam; (C) oxazepam.
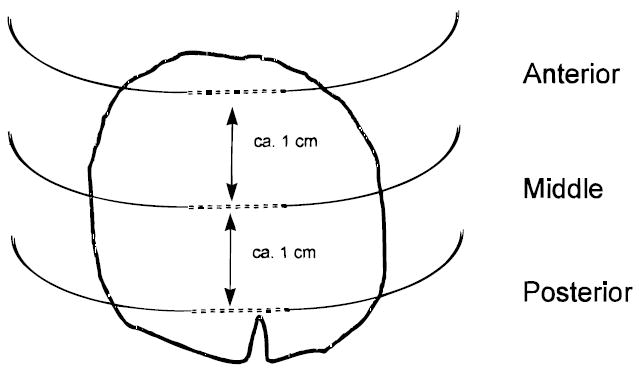
Placement of microdialysis probes implanted into the median lobe of the liver (viewed from the ventral surface) used to monitor phenol metabolism.
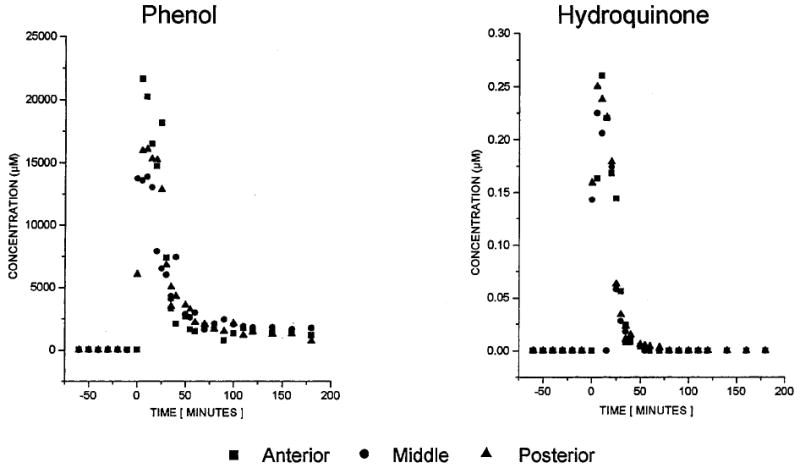
Typical concentration–time course for phenol (left) and hydroquinone (right) during and after a 20-min iv infusion of phenol (administration corresponding to 0–20 min).
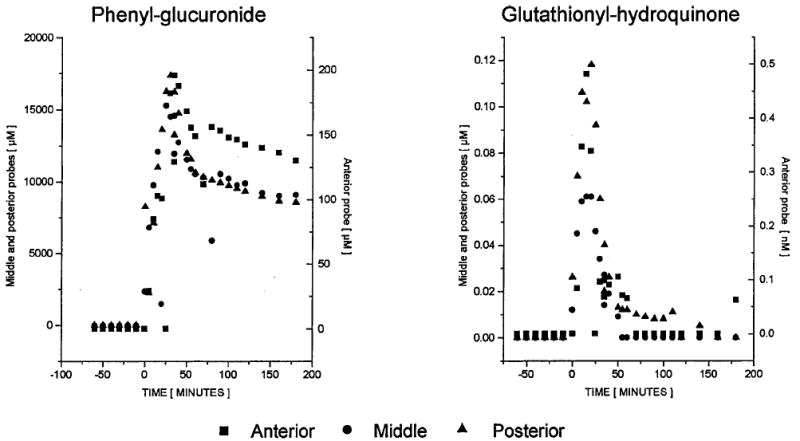
Typical concentration–time course for phenyl-glucuronide (left) and glutathionyl-hydroquinone (right) during and after a 20-min iv infusion of phenol (administration corresponding to 0–20 min). Note: scale for the anterior probe is the right-hand axis.
References
-
- Scott DO, Lunte CE. In vivo microdialysis sampling in the bile, blood, and liver of rats to study the disposition of phenol. Pharm Res. 1993;10:335–342. - PubMed
-
- Dempsey E, Diamond D, Smyth MR, Malone MA, Rabenstein K, McShane A, McKenna M, Keaveny TV, Freaney R. In vitro optimisation of a microdialysis system with potential for on-line monitoring of lactate and glucose in biological samples. Analyst. 1997;122:185–189. - PubMed
-
- Marsala M, Malmberg A, Yaksh T. The spinal loop dialysis catheter: characterization of use in the unanesthetized rat. J Neurosci. 1995;62:43–53. - PubMed
-
- Khan I, Marsala M, Printz M, Taylor P, Yaksh T. Intrathecal nicotinic agonist-elicited release of excitatory amino acids as measured by in vivo spinal microdialysis in rats. J Pharm Exp Ther. 1996;278:97–106. - PubMed
-
- Evrard PA, Deridder G, Verbeeck RK. Intravenous microdialysis in the mouse and the rat: development and pharmacokinetic application of a new probe. Pharm Res. 1996;13:12–17. - PubMed
Publication types
MeSH terms
Substances
Grants and funding
LinkOut - more resources
Full Text Sources
Other Literature Sources
Medical
