

Imaging of multicellular large-scale rhythmic calcium waves during zebrafish gastrulation
- PMID: 9874788
- PMCID: PMC15109
- DOI: 10.1073/pnas.96.1.157
Imaging of multicellular large-scale rhythmic calcium waves during zebrafish gastrulation
Abstract
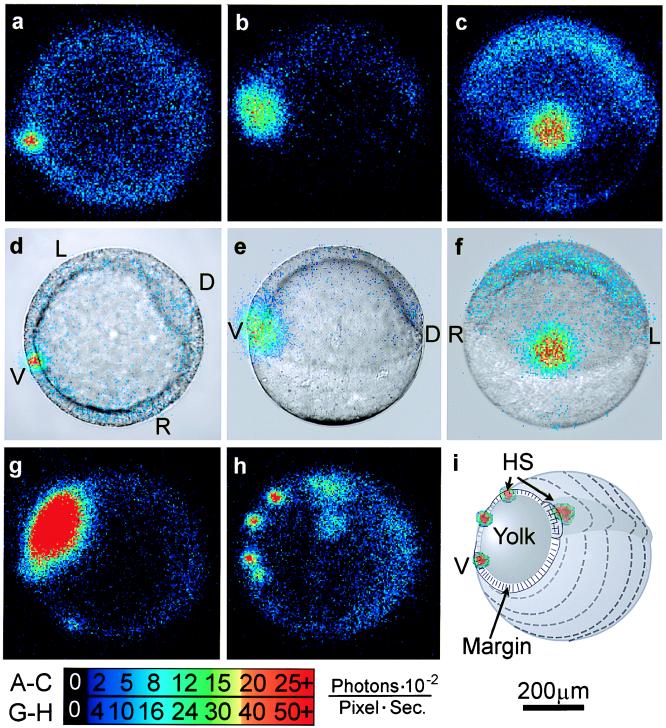
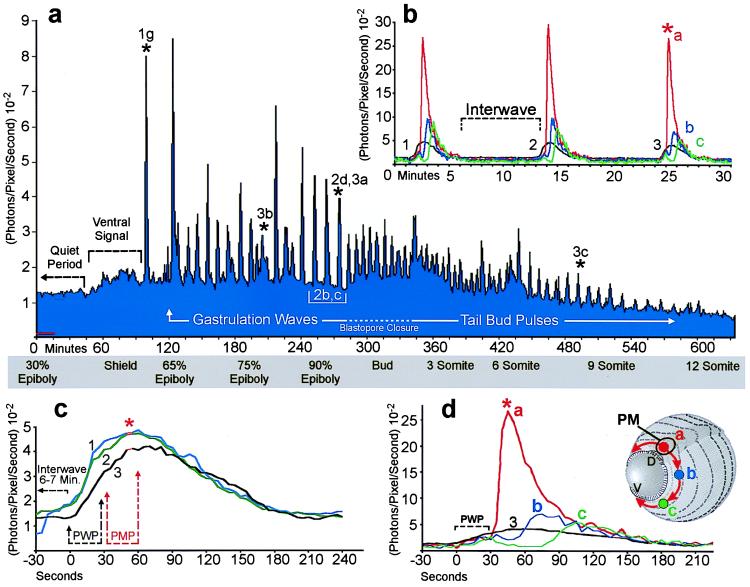
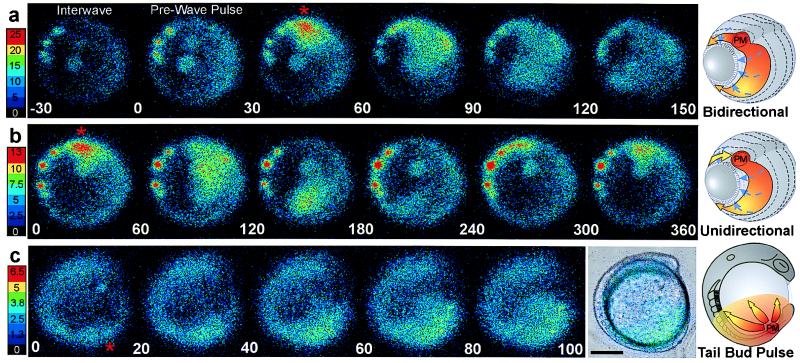
Oscillations of cytosolic free calcium levels have been shown to influence gene regulation and cell differentiation in a variety of model systems. Intercellular calcium waves thus present a plausible mechanism for coordinating cellular processes during embryogenesis. Herein we report use of aequorin and a photon imaging microscope to directly observe a rhythmic series of intercellular calcium waves that circumnavigate zebrafish embryos over a 10-h period during gastrulation and axial segmentation. These waves first appeared at about 65% epiboly and continued to arise every 5-10 min up to at least the 16-somite stage. The waves originated from loci of high calcium activity bordering the blastoderm margin. Several initiating loci were active early in the wave series, whereas later a dorsal marginal midline locus predominated. On completion of epiboly, the dorsal locus was incorporated into the developing tail bud and continued to generate calcium waves. The locations and timing at which calcium dynamics are most active appear to correspond closely to embryonic cellular and syncytial sites of known morphogenetic importance. The observations suggest that a panembryonic calcium signaling system operating in a clock-like fashion might play a role during vertebrate axial patterning.
Figures
Similar articles
-
Imaging intercellular calcium waves during late epiboly in intact zebrafish embryos.Zygote. 2003 May;11(2):175-82. doi: 10.1017/s0967199403002211. Zygote. 2003. PMID: 12828417
-
Ca2+ signaling and early embryonic patterning during the blastula and gastrula periods of zebrafish and Xenopus development.Biochim Biophys Acta. 2006 Nov;1763(11):1192-208. doi: 10.1016/j.bbamcr.2006.08.004. Epub 2006 Aug 5. Biochim Biophys Acta. 2006. PMID: 16962186 Review.
-
A role for DNA methylation in gastrulation and somite patterning.Dev Biol. 1999 Feb 15;206(2):189-205. doi: 10.1006/dbio.1998.9105. Dev Biol. 1999. PMID: 9986732
-
Characterization of Ca(2+) signaling in the external yolk syncytial layer during the late blastula and early gastrula periods of zebrafish development.Biochim Biophys Acta. 2013 Jul;1833(7):1641-56. doi: 10.1016/j.bbamcr.2012.10.031. Epub 2012 Nov 8. Biochim Biophys Acta. 2013. PMID: 23142640
-
Spatially distinct domains of cell behavior in the zebrafish organizer region.Biochem Cell Biol. 1997;75(5):563-77. Biochem Cell Biol. 1997. PMID: 9551180 Review.
Cited by
-
Plant calcium signaling and monitoring: pros and cons and recent experimental approaches.Protoplasma. 2001;218(1-2):1-23. doi: 10.1007/BF01288356. Protoplasma. 2001. PMID: 11732314 Review.
-
Calcium Signaling in Vertebrate Development and Its Role in Disease.Int J Mol Sci. 2018 Oct 30;19(11):3390. doi: 10.3390/ijms19113390. Int J Mol Sci. 2018. PMID: 30380695 Free PMC article. Review.
-
Calcium spikes, waves and oscillations in a large, patterned epithelial tissue.Sci Rep. 2017 Feb 20;7:42786. doi: 10.1038/srep42786. Sci Rep. 2017. PMID: 28218282 Free PMC article.
-
Ca2+ dynamics in zebrafish morphogenesis.PeerJ. 2017 Jan 19;5:e2894. doi: 10.7717/peerj.2894. eCollection 2017. PeerJ. 2017. PMID: 28133572 Free PMC article.
-
Wnt signal transduction pathways.Organogenesis. 2008 Apr;4(2):68-75. doi: 10.4161/org.4.2.5851. Organogenesis. 2008. PMID: 19279717 Free PMC article.
References
-
- Driever W. Curr Opin Genet Dev. 1995;5:610–618. - PubMed
-
- Stennard F, Ryan K, Gurdon J B. Curr Opin Genet Dev. 1997;7:620–627. - PubMed
-
- Sasai Y, De Robertis E M. Dev Biol. 1997;182:5–20. - PubMed
-
- Berridge M J. Nature (London) 1993;361:315–325. - PubMed
-
- Jaffe L F. Cell Calcium. 1993;14:736–745. - PubMed
Publication types
MeSH terms
Substances
Grants and funding
LinkOut - more resources
Full Text Sources
Other Literature Sources
