. 1999 Jan;119(1):331-42.
doi: 10.1104/pp.119.1.331.

Regulation of S-like ribonuclease levels in Arabidopsis. Antisense inhibition of RNS1 or RNS2 elevates anthocyanin accumulation

Affiliations

Regulation of S-like ribonuclease levels in Arabidopsis. Antisense inhibition of RNS1 or RNS2 elevates anthocyanin accumulation

P A Bariola et al. Plant Physiol. 1999 Jan.

Abstract

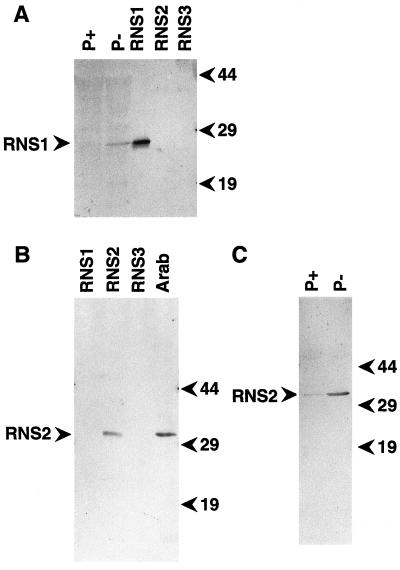
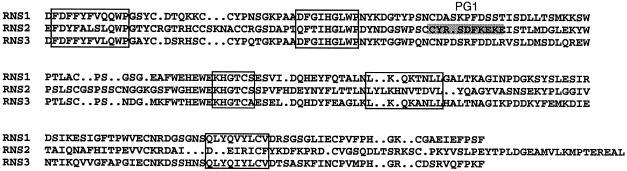
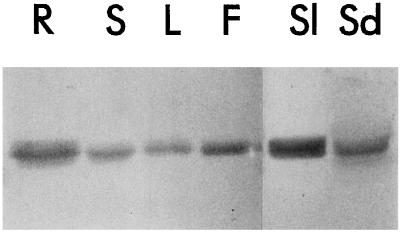
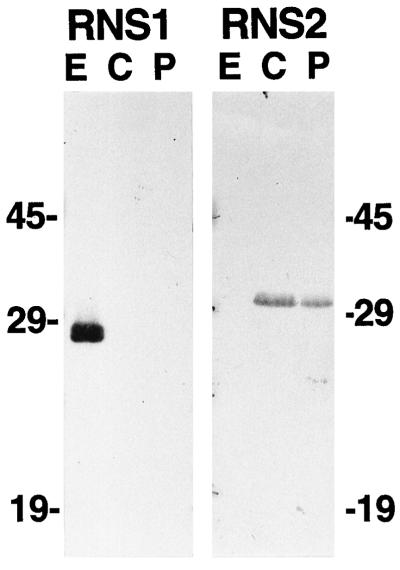
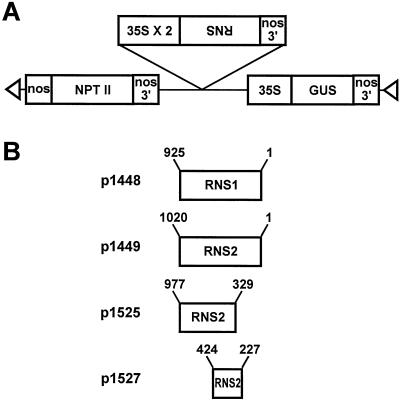
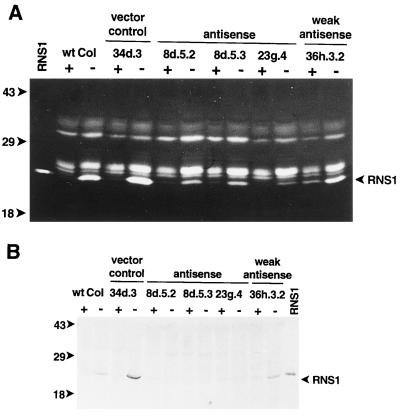
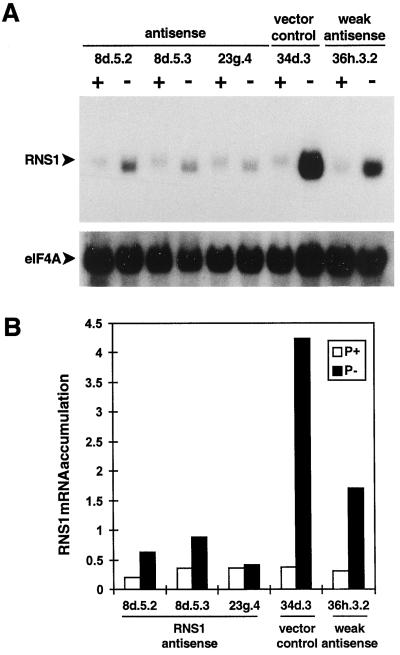
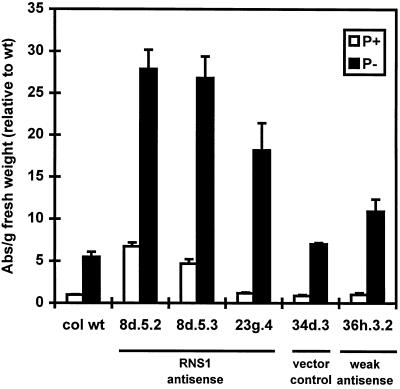
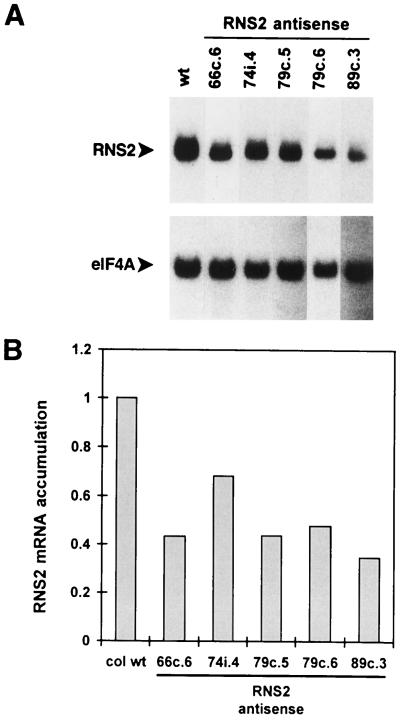
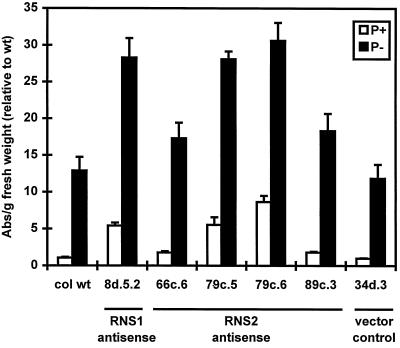
The S-like ribonucleases (RNases) RNS1 and RNS2 of Arabidopsis are members of the widespread T2 ribonuclease family, whose members also include the S-RNases, involved in gametophytic self-incompatibility in plants. Both RNS1 and RNS2 mRNAs have been shown previously to be induced by inorganic phosphate (Pi) starvation. In our study we examined this regulation at the protein level and determined the effects of diminishing RNS1 and RNS2 expression using antisense techniques. The Pi-starvation control of RNS1 and RNS2 was confirmed using antibodies specific for each protein. These specific antibodies also demonstrated that RNS1 is secreted, whereas RNS2 is intracellular. By introducing antisense constructs, mRNA accumulation was inhibited by up to 90% for RNS1 and up to 65% for RNS2. These plants contained abnormally high levels of anthocyanins, the production of which is often associated with several forms of stress, including Pi starvation. This effect demonstrates that diminishing the amounts of either RNS1 or RNS2 leads to effects that cannot be compensated for by the actions of other RNases, even though Arabidopsis contains a large number of different RNase activities. These results, together with the differential localization of the proteins, imply that RNS1 and RNS2 have distinct functions in the plant.


Figures

Figure 1
Figure 1
Immunoblot characterization of anti-RNS1 and anti-RNS2 antibodies and RNS1 and RNS2 regulation in response to Pi starvation. Protein samples were resolved by SDS-PAGE, transferred to a membrane, and immunodetected with the corresponding antiserum. A, Immunoblot with lanes containing approximately 70 ng of RNS1, RNS2, or RNS3 in supernatant from RNase-expressing yeast cells as indicated or 30 μg of total proteins from Arabidopsis seedlings grown on media rich (P+) or deficient (P−) in Pi. The blot was developed using anti-RNS1 antibodies. B, Immunoblot with lanes containing approximately 300 ng of RNS1, RNS2, or RNS3, as indicated, from supernatant from RNase-expressing yeast cells. Arab, Lane containing 50 μg of proteins extracted from aboveground tissues of 5-week-old wild-type Arabidopsis plants. The blot was developed using anti-RNS2 antibodies. C, Increase in RNS2 abundance during Pi starvation. Lanes contain 25 μg of protein extracts from seedlings grown on media rich (P+) or deficient (P−) in Pi. The blot was developed using the same antibody as in B. Positions of molecular mass markers (in kD) are shown to the left of the blots.
Figure 2
Figure 2
Synthetic peptide used for producing anti-RNS2 antibodies. Deduced amino acid sequences of RNS1, RNS2, and RNS3 are aligned, beginning with residues 7 and 12 of RNS1 and RNS2 proteins, respectively. The region corresponding to peptide PG1 is shaded. Boxes highlight the conserved regions described in Ioerger et al. (1991).
Figure 3
Figure 3
Distribution of RNS2 among various organs of Arabidopsis. Protein extracts (30 μg per lane) were made from organs of 4- to 5-week-old wild-type plants and resolved by SDS-PAGE. Proteins were then transferred to a membrane and immunodetected with anti-RNS2 serum. R, Roots; S stems; L, leaves; F, flowers; Sl, siliques; Sd, seeds.
Figure 4
Figure 4
Extra- and intracellular localization of RNS1 and RNS2. Protein samples were prepared from Arabidopsis cell cultures as described in Methods. Seventy-five micrograms of protein per lane was separated on SDS-PAGE gels, transferred to a membrane, and immunodetected with anti-RNS1 or anti-RNS2 serum. E, Extracellular fraction; C, whole-cell lysate; P, protoplast lysate.
Figure 5
Figure 5
Structure of RNS1 and RNS2 antisense constructs p1448, p1449, p1525, and p1527. A, General structure of the T-DNA region of the antisense RNS transformation vectors. B, RNS cDNA fragments fused in the antisense orientation between the doubly enhanced cauliflower mosaic virus 35S promoter and the nos 3′ end. Sequences flanking the 35S-antisense RNS-nos cassette are derived from the plasmid pBI121, as described previously (Jefferson, 1987). Numbers refer to nucleotide positions in the cDNA sequences. Triangles indicate the right and left borders of the T-DNA.
Figure 6
Figure 6
Decreased RNS1 activity and protein in RNS1 antisense lines. T3 or T4 seedlings of antisense RNS1 lines were germinated on AGM medium, transferred 2 d after germination to media rich (+) or deficient (−) in Pi, and grown for an additional 7 d. Protein extracts were prepared from all kanamycin-resistant seedlings and each sample was resolved on RNase activity gels (A, 50 μg per lane) or SDS-PAGE gels for immunoblots (B, 100 μg per lane). wt Col, Columbia wild type; vector control, transgenic line containing pBI121 vector; weak antisense, transgenic line containing construction p1448 but with a near-normal amount of RNS1 activity; RNS1, RNS1 protein produced in yeast. The bands of RNS1 activity are indicated. Positions of molecular mass standards (in kD) are shown to the left of the gels.
Figure 7
Figure 7
Decreased RNS1 mRNA levels in RNS1 antisense lines. Seedlings of antisense RNS1 lines were grown as described in Figure 6, and total RNA was isolated from all kanamycin-resistant seedlings. A, RNA gel blots containing 10 μg of sample per lane were hybridized to an eIF4A probe and subsequently to the antisense RNS1 probe. Labels are the same as in Figure 6. B, RNS1 and eIF4A counts were quantitated with a phosphor imager, RNS1 counts were divided by eIF4A counts for each lane, and the results were plotted to represent RNS1 mRNA accumulation in each line.
Figure 8
Figure 8
Quantitation of anthocyanin levels in seedlings of RNS1 antisense lines. Seedlings of antisense RNS1 lines were grown as described in Figure 6, and anthocyanins were extracted as described in Methods. Each bar represents four independent plates. A530 minus A657 was taken as a measure of anthocyanin content, and for each sample the absorbance (Abs) reading was divided by the fresh weight of the sample in grams. The results were normalized using an arbitrary value of 1 for the wild-type line (col wt) grown on Pi-rich medium (1 = 0.14 absorbance units per gram fresh weight). Labels are the same as in Figure 6. Error bars correspond to ±se.
Figure 9
Figure 9
RNS2 mRNA levels in RNS2 antisense lines. A, Total RNA was extracted from leaves of 4-week-old kanamycin-resistant, soil-grown antisense RNS2 lines. RNA gel blots containing 6 μg of sample per lane were hybridized to an antisense RNS2 probe and subsequently to the eIF4A probe. wt, Wild type. B, RNS2 and eIF4A counts for the bands shown in A were quantitated with a phosphor imager. RNS2 counts were divided by eIF4A counts for each lane, and these results were divided by the RNS2 to eIF4A ratio for the wild-type control lane to show relative differences in RNS2 mRNA levels. col wt, Columbia wild type.
Figure 10
Figure 10
Seedlings of RNS2 antisense lines grown as described for antisense RNS1 lines in Figure 6. Anthocyanins were extracted as described in Methods. Each bar represents at least six independent plates. Absorbance was measured and results were normalized as in Figure 8 (1 = 0.14 absorbance units per gram fresh weight). An RNS1 antisense line (8d.5.2) was included to facilitate comparison. col wt, Columbia wild type. Error bars correspond to ±se.

References

    1. Axelos M, Curie C, Mazzolini L, Bardet C, Lescure B. A protocol for transient gene expression in Arabidopsis thaliana protoplast isolated from cell suspension cultures. Plant Physiol Biochem. 1992;30:123–128.
    1. Bariola PA, Green PJ (1997) Plant ribonucleases. In G D'Alessio, JF Riordan, eds, Ribonucleases: Structures and Functions. Academic Press, New York, pp 163–190
    1. Bariola PA, Howard CJ, Taylor CB, Verburg MT, Jaglan VD, Green PJ. The Arabidopsis ribonuclease gene RNS1 is tightly controlled in response to phosphate limitation. Plant J. 1994;6:673–685. - PubMed
    1. Bar-Peled M, Raikhel NV. Characterization of AtSED12 and AtSAR1. Proteins likely involved in endoplasmic reticulum and golgi transport. Plant Physiol. 1997;114:315–324. - PMC - PubMed
    1. Bechtold N, Ellis J, Pelletier G. In planta Agrobacterium-mediated gene transfer by infiltration of adult Arabidopsis thaliana plants. C R Acad Sci. 1993;316:1194–1199.

Publication types

MeSH terms