Review
. 1999 Jan;12(1):126-46.
doi: 10.1128/CMR.12.1.126.

The evolutionary biology and population genetics underlying fungal strain typing

Affiliations
Review

The evolutionary biology and population genetics underlying fungal strain typing

J W Taylor et al. Clin Microbiol Rev. 1999 Jan.

Abstract

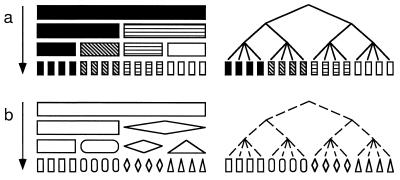
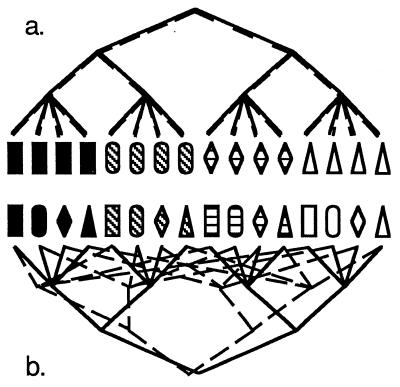
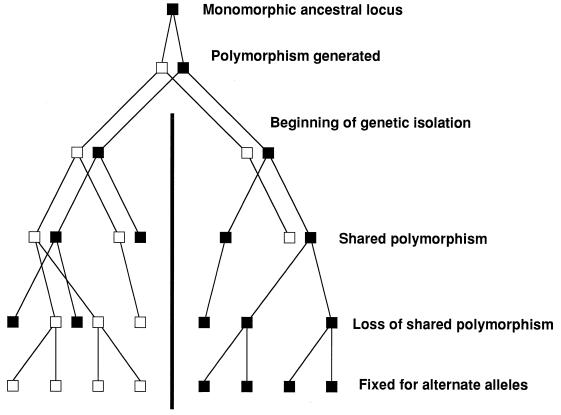
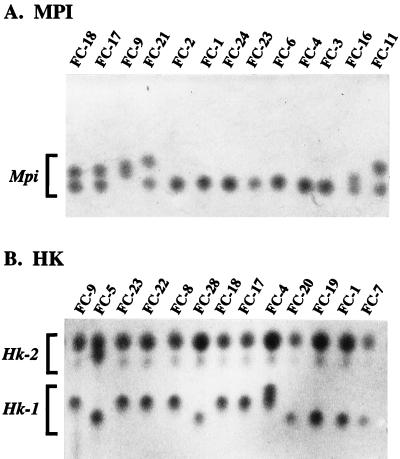
Strain typing of medically important fungi and fungal population genetics have been stimulated by new methods of tapping DNA variation. The aim of this contribution is to show how awareness of fungal population genetics can increase the utility of strain typing to better serve the interests of medical mycology. Knowing two basic features of fungal population biology, the mode of reproduction and genetic differentiation or isolation, can give medical mycologists information about the intraspecific groups that are worth identifying and the number and type of markers that would be needed to do so. The same evolutionary information can be just as valuable for the selection of fungi for development and testing of pharmaceuticals or vaccines. The many methods of analyzing DNA variation are evaluated in light of the need for polymorphic loci that are well characterized, simple, independent, and stable. Traditional population genetic and new phylogenetic methods for analyzing mode of reproduction, genetic differentiation, and isolation are reviewed. Strain typing and population genetic reports are examined for six medically important species: Coccidioides immitis, Histoplasma capsulatum, Candida albicans, Cryptococcus neoformans, Aspergillus fumigatus, and A. flavus. Research opportunities in the areas of genomics, correlation of clinical variation with genetic variation, amount of recombination, and standardization of approach are suggested.


Figures

FIG. 1
FIG. 1
Relationship between characteristics used for strain typing and their evolutionary history. (a) Increasing diversity of pigmentation through time and the evolutionary relationships of individuals with different pigmentation. (b) Increasing diversity of shape through time and the evolutionary relationships of individuals with different shapes.
FIG. 2
FIG. 2
Effect of reproductive mode on the congruence of evolutionary relationships based on the two characters given in Fig. 1. (a) In a clonal organism, the two features are associated, are found in a few combinations (black rectangles, white triangles, etc.), and have the same evolutionary history. (b) In a recombining organism, the two features are not associated and are found in all possible combinations. As a result, the evolutionary histories of the two features are incongruent.
FIG. 3
FIG. 3
How genetic isolation leads to loss of shared polymorphisms in descendent populations. In the absence of selection to maintain polymorphisms, the fate of all polymorphic loci is fixation through genetic drift. Beginning with two genetically isolated populations that share the polymorphism of the ancestral population, first one and then the other population becomes fixed for one allele. In this case, the two descendent populations have become fixed for alternate alleles, making this locus useful for determining the population of an unknown individual.
FIG. 4
FIG. 4
Starch gel electrophoresis of polymorphic enzymatic proteins in C. albicans isolates. (A) Proteins with the activity of mannose-6-phosphate isomerase (MPI) showing several alleles based on electrophoretic mobility in homozygous and heterozygous individuals of this diploid yeast. (B) Proteins with the activity of hexokinase (HK) showing allelic differences at two loci, Hk-1 and Hk-2. Reprinted from reference with permission of the publisher.
FIG. 5
FIG. 5
EKs of A. nidulans. (A) Reference isolates of A. nidulans (Glasgow) and Saccharomyces cerevisiae plus three isolates with unusual karyotypes. (B) Isolates from outside Great Britain. In general, the EKs are very similar, as is expected for a meiotic fungus like A. nidulans (Emericella nidulans). However, variation is present. Note the dispensable B-chromosome in M85 (size, ca. 1.1 Mb), the very different pattern in N89 (due to a translocation), a similarly different pattern in D34 (also probably due to translocation), and the relatively small length variation in many chromosomes. Reprinted from reference with permission of the publisher.
FIG. 6
FIG. 6
Multiple origins of the same RFLP fragment due to independent losses of a restriction site. (a) Three sites creating four RFLP fragments. (b) Loss of the middle site through a t-to-c transition, leading to three RFLP fragments through the loss of fragments 2 and 3 and the gain of fragment 5. (c) Loss of the middle site through a t-to-g transversion, leading to the same three RFLP fragments via the same new fragments.
FIG. 7
FIG. 7
Multiple losses of PCR-amplified DNA regions due to independent nucleotide substitutions in the two priming regions. (a) PCR amplification of a DNA sequence showing incorporation of the primer oligonucleotides at each end of the sequence. (b) Failure of PCR amplification due to a G-to-A transition that defeats priming at the left-hand priming region. (c) Failure to amplify DNA due to a second transition that defeats priming at the right-hand priming region.
FIG. 8
FIG. 8
Simulated data sets for a clonal and recombining organism used to explain analytical methods illustrated in Fig. 9 and 11. Each data set consists of seven biallelic loci in seven individuals. The clonal data set was constructed without homoplasy, and the recombined data set was constructed by resampling the alleles at each locus with replacement, as diagrammed in Fig. 10.
FIG. 9
FIG. 9
Method to detect association among loci in individuals characterized by multilocus genotypes, i.e., distinguishing between clonal and recombining organisms by using the distribution of pairwise comparisons of their multilocus genotypes. (a) Distance matrices from all pairwise comparison for clonal and recombining organisms. (b) Bar graph of the frequency distribution of pairwise distances among multilocus genotypes for clonal and recombining organisms. Clonal organisms have an excess of close and distant distances and a high variance. Recombining organisms have a more normal distribution and a low variance. (c) Comparison of the rescaled variance (IA) of clonal and recombining organisms to IAs for 1,000 artificially recombined data sets. Note that the IA of the clonal data is significantly higher than the distribution of IAs for the artificially recombined data sets, while the IA for the recombining organism is close to the mean of the IAs for the artificially recombined data sets.
FIG. 10
FIG. 10
Diagram showing how observed data are shuffled to mimic the effects of recombination. For each locus, the alleles are resampled without replacement to shuffle the alleles among the individuals. The process is repeated for each locus to make a recombined data set. (a) Observed data are shown. (b and c) Alleles at the first locus are resampled without replacement to create an artificially recombined locus.
FIG. 11
FIG. 11
Use of parsimony tree length to distinguish between clonal reproduction and recombination. (a) Parsimony tree for a clonal organism based on data in Fig. 8. Note that it is fully resolved and as short as possible (seven loci, seven steps), because the data set was constructed without homoplasy. Of course, not all clonal data sets would be free of homoplasy, but methods have been proposed to estimate the amount of homoplasy expected for a clonal organism (81). (b) Parsimony tree for a recombining organism based on data in Fig. 7a. Note that this tree is a consensus of nine most parsimonious trees, all of which are four steps longer than the shortest possible tree. The lack of resolution and the longer tree length are the result of each locus having a different evolutionary history. (c) Tree length of a clonal organism compared to the tree lengths for 1,000 artificially recombined data sets (cf. Fig. 10). Note that only 1 of 1,000 data sets had a tree length as short as the observed data. (d) Tree length of a recombining organism compared to the tree lengths for 1,000 artificially recombined data sets. Note that all but 4 of 1,000 data sets had a tree length as short as the observed data.
FIG. 12
FIG. 12
Partition homogeneity test of A. flavus (group 1), showing that the sum of observed parsimony tree lengths for five gene genealogies is significantly (P < 0.0001) shorter than the distribution of summed tree lengths following shuffling of polymorphic sites among the five genes (Fig. 13). Because shuffling of sites should not affect tree length for clonal organisms, the inference is that A. flavus is recombining. Reprinted from reference with permission of the publisher.
FIG. 13
FIG. 13
Shuffling of polymorphic sites among three genes. Each scrambled data set is made by sampling sites without replacement while maintaining the number of sites for each gene. Note that this shuffling differs from that in Fig. 9, where alleles are shuffled among loci. Here, the alleles are maintained in their original order but the sites (loci) are shuffled.
FIG. 14
FIG. 14
Simulation of the behavior of Wright’s Fst, estimated by using theta (31), a statistic used to infer genetic isolation. Theta is defined as (Qq)/(1 − q), where Q is the probability that two randomly sampled genes within a population are the same allele and q is the probability that two genes randomly selected from different populations are the same allele. (a) Behavior of theta when the locus may be fixed in both populations. Theta ranges from 0 when each population is fixed for the same allele to 1 when each population is fixed for a different allele. (b) Behavior of theta when the locus may be fixed in one population but is balanced for the two alleles in the other (50:50). Theta ranges from 0 when allele frequencies are identical (50:50) to ca. 0.5 when one population is fixed for either allele and the other population remains balanced. Populations for which data are biased toward polymorphic loci result in overestimates of gene flow compared to populations for which both polymorphic and monomorphic loci are sampled.

References

    1. Anderson J B, Kohn L M. Clonality in soilborne, plant-pathogenic fungi. Annu Rev Phytopathol. 1995;33:369–391. - PubMed
    1. Anderson J B, Korhonen K, Ullrich R C. Relationships between European and North American biological species of Armillaria mellea. Exp Mycol. 1980;4:87–95.
    1. Appel D J, Gordon T R. Relationships among pathogenic and nonpathogenic isolates of Fusarium oxysporum based on the partial sequence of the intergenic spacer region of the ribosomal DNA. Mol Plant-Microbe Interact. 1996;9:125–138. - PubMed
    1. Archie J W. A randomization test for phylogenetic information in systematic data. Syst Zool. 1989;38:239–252.
    1. Aulakh H S, Strauss S E, Kwon-Chung K J. Genetic relatedness of Filobasidiella neoformans (Cryptococcus neoformans) and Filobasidiella bacillispora (Cryptococcus bacillosporus) as determined by deoxyribonucleic acid base composition and sequence homology studies. Int J Syst Bacteriol. 1981;31:97–103.

Publication types