. 1999 Jan 15;19(2):644-52.
doi: 10.1523/JNEUROSCI.19-02-00644.1999.

Agonist-induced changes in substituted cysteine accessibility reveal dynamic extracellular structure of M3-M4 loop of glutamate receptor GluR6

Affiliations

Agonist-induced changes in substituted cysteine accessibility reveal dynamic extracellular structure of M3-M4 loop of glutamate receptor GluR6

S S Basiry et al. J Neurosci. .

Abstract

Recent evidence suggests that the transmembrane topology of ionotropic glutamate receptors differs from other members of the ligand-gated ion channel superfamily. However, the structure of the segment linking membrane domains M3 and M4 (the M3-M4 loop) remains controversial. Although various data indicate that this loop is extracellular, other results suggest that serine residues in this segment are sites of phosphorylation and channel modulation by intracellular protein kinases. To reconcile these data, we hypothesized that the M3-M4 loop structure is dynamic and, more specifically, that the portion containing putative phosphorylation sites may be translocated across the membrane to the cytoplasmic side during agonist binding. To test this hypothesis, we mutated Ser 684, a putative cAMP-dependent protein kinase site in the kainate-type glutamate receptor GluR6, to Cys. Results of biochemical and electrophysiological experiments are consistent with Cys 684 being accessible, in the unliganded state, from the extracellular side to modification by a Cys-specific biotinylating reagent followed by streptavidin (SA). Interestingly, our data suggest that this residue becomes inaccessible to the extracellular biotinylating reagent during agonist binding. However, we find it unlikely that Cys 684 undergoes membrane translocation, because the addition of SA to Cys-biotinylated GluR6(S684C) has no effect on peak glutamate-evoked current and only a small effect on macroscopic desensitization. We conclude that residue 684 in GluR6 is extracellular in the receptor-channel's closed, unliganded state and does not cross the membrane after agonist binding. However, an agonist-induced conformational change in the receptor substantially alters accessibility of position 684 to the extracellular environment.


Figures

Fig. 1.
Fig. 1.
Glutamate dose–response curves forwt GluR6 and GluR6(S684C) are similar. Peak glutamate-evoked current was recorded from cells transfected with either wt GluR6 (▪) or GluR6(S684C) (○), and the amplitude (I) was normalized to the peak current response to 10 mm glutamate (Imax) for each cell. Points represent data from n = 3–9 different cells. Curves were fitted to the equation I =Imax (1/(1 + (EC50/[GLU])nH)), where nH is the Hill coefficient. The EC50 and nH values were 330 ± 20 μm and 1.1 for wt GluR6, and 320 ± 10 μm and 1.0 for GluR6(S684C).
Fig. 2.
Fig. 2.
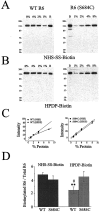
wt GluR6 shows significantly less cysteine-specific biotinylation than GluR6(S684C). A, B, Representative Western blot analyses of wt GluR6 and GluR6(S684C) after incubation of transfected cells with NHS-SS-biotin (A; primary amine-specific) or HPDP-biotin (B; cysteine-specific), as described in Materials and Methods. 1, 2, 4, and8% represent the fraction of the total cell membrane isolate, and B represents the total protein precipitated by streptavidin-linked beads, loaded in each lane. C, For blots shown in A and B, band intensities were measured by densitometry from lanes containing 1, 2, 4, and 8% of the total membrane protein to generate a standard curve. From these curves, the amount of biotinylated GluR6 was calculated as a fraction of the total membrane GluR6. D, Bars represent data from n = 7–12 different experiments.# Significant difference (p < 0.05) between wt GluR6 and GluR6(S684C) for biotinylation by HPDP-biotin; **significant difference (p < 0.001) for streptavidin bead recovery of wt GluR6 after incubation with NHS-SS-biotin versus HPDP-biotin (both by unpaired t test).
Fig. 3.
Fig. 3.
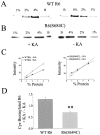
Cys-specific biotinylation of GluR6(S684C) shows significant decrease with kainate binding. A, B, Representative Western blot analyses of wt GluR6 (A) and GluR6(S684C) (B) after incubation of transfected cells with HPDP-biotin in the presence (+ KA) versus absence (− KA) of 1 mm kainate. Left and right panels are from same gel. Labeling of lanes is as described in Figure 2. C, Standard curves were generated from blots shown in A and B, as described in Figure2C, and such curves were used to determine the amount of Cys-biotinylated GluR6. D, Ratio of Cys-biotinylated GluR6 in the presence versus absence of kainate was calculated for each of n = 8 (WT R6) orn = 9 [R6(S684C)] different experiments. **Significant difference (p < 0.01 by unpaired t test) between wt GluR6 and GluR6(S684C).
Fig. 4.
Fig. 4.
Occupation of ligand binding site and channel activation required to render Cys 684 inaccessible to HPDP-biotin.A, Binding of another agonist, glutamate, decreases Cys-specific biotinylation of GluR6(S684C). Representative Western blot analysis of GluR6(S684C)-transfected cells treated with HPDP-biotin in the absence (− Glu) versus presence (+Glu) of 1 mm glutamate. B, Antagonist binding does not alter Cys-specific biotinylation of GluR6(S684C). Representative Western blot analysis of GluR6(S684C)-transfected cells treated with HPDP-biotin in the absence versus presence of 10 μm CNQX. For both Aand B, left and right panels are from same gel. Labeling of lanes is as described in Figure 2. C, Standard curves were generated from blots shown in A and B, as described in Figure2C,D. Ratio of Cys-biotinylated GluR6 in the presence versus absence of Glu or CNQX was calculated from n= 4 different experiments for each condition: WT R6, +Glu/−Glu; S684C, +Glu/−Glu; and S684C, +CNQX/−CNQX. *Significant difference (p < 0.05 by unpaired ttest) between wt GluR6 and GluR6(S684C) for +Glu/−Glu;# significant difference (p < 0.05, unpaired t test) between +Glu/−Glu and +CNQX/−CNQX for GluR6(S684C).
Fig. 5.
Fig. 5.
Cys-specific biotinylation decreases peak current amplitude and slows desensitization for both wt GluR6 and GluR6(S684C). Whole-cell patch-clamp recordings were made under voltage clamp (VH = −60 mV) from cells transfected with either wt GluR6 or GluR6(S684C).A, Top, Representative current responses to rapid application of 1 mm glutamate (indicated bybar) before (control) and after (HPDP) a 15 min incubation with 0.03 mg/ml extracellular HPDP-biotin followed by a 6–8 min washout period. A,Bottom, The gain of each HPDP trace has been increased to match the peak current amplitude of the corresponding control trace to better illustrate the slowing of desensitization. B, Peak current amplitude after 15 min incubation (and 6–8 min washout) with 1% DMSO (vehicle), 0.03 mg/ml HPDP-biotin (in 1% DMSO), or 0.03 mg/ml HPDP-biotin in the continuous presence of 1 mm KA (+ KA), was normalized to the pretreatment peak current amplitude (I0). Bars represent data fromn = 5 different cells for vehicle [results fromwt GluR6- and GluR6 (S684C)-transfected cells were pooled], n = 11 for wt R6,n = 9 for S684C, or n = 8 for S684C + KA. **Significant difference between vehicle and HPDP-biotin-treated groups by unpaired t test,p < 0.01. C, Desensitization time constant (τD) after treatment with HPDP-biotin (as above) was normalized to pretreatment value (τD (initial)). Bars represent data from n = 5 (vehicle), 11 (wt R6), 9 (S684C), or 8 (S684C +KA) different cells.
Fig. 6.
Fig. 6.
Extracellular streptavidin slows desensitization of Cys-biotinylated GluR6(S684C). Whole-cell patch-clamp recordings were made from cells expressing wt GluR6 or GluR6(S684C), as in Figure 5. A, Representative current responses to 1 mm glutamate recorded from three different cells after HPDP-biotin treatment and washout period (HPDP; as in Fig. 5), and then 10–15 min incubation with 0.01 mg/ml streptavidin followed by 6–8 min washout (SA). In far right panel, the cell was treated continuously with 1 mm kainate during the time of incubation with HPDP-biotin (HPDP + KA).B, Peak current amplitude after streptavidin treatment and washout (I(SA)) was normalized to peak current amplitude immediately after HPDP-biotin treatment (with or without 1 mm kainate) and washout period (I(HPDP±KA)). C, Desensitization time constant measured after incubation with streptavidin was normalized to that measured immediately before streptavidin treatment (as in B). In bothB and C, bars represent data fromn = 5 for wt R6, −KA;n = 6 for S684C, −KA; or n = 5 for S684C, + 1 mm KA. *Significant difference between groups by unpaired t test, p = 0.02.

References

    1. Bennett JA, Dingledine R. Topology profile for a glutamate receptor: three transmembrane domains and a channel-lining reentrant membrane loop. Neuron. 1995;14:3731–3784. - PubMed
    1. Chen N, Moshaver A, Raymond LA. Differential sensitivity of recombinant N-methyl-d-aspartate receptor subtypes to zinc inhibition. Mol Pharmacol. 1997;51:1015–1023. - PubMed
    1. Choi DW. Glutamate receptors and the induction of excitotoxic neuronal death. Prog Brain Res. 1994;100:47–51. - PubMed
    1. Coyle JT, Puttfarcken P. Oxidative stress, glutamate, and neurodegenerative disorders. Science. 1993;262:689–695. - PubMed
    1. Hall RA, Hansen A, Andersen PH, Soderling TR. Surface expression of the AMPA receptor subunits GluR1, GluR2, and GluR4 in stably transfected baby hamster kidney cells. J Neurochem. 1997;68:625–630. - PubMed

Publication types

MeSH terms

LinkOut - more resources