. 1999 Jan 15;19(2):726-36.
doi: 10.1523/JNEUROSCI.19-02-00726.1999.

Calcium channel types with distinct presynaptic localization couple differentially to transmitter release in single calyx-type synapses

Affiliations

Calcium channel types with distinct presynaptic localization couple differentially to transmitter release in single calyx-type synapses

L G Wu et al. J Neurosci. .

Abstract

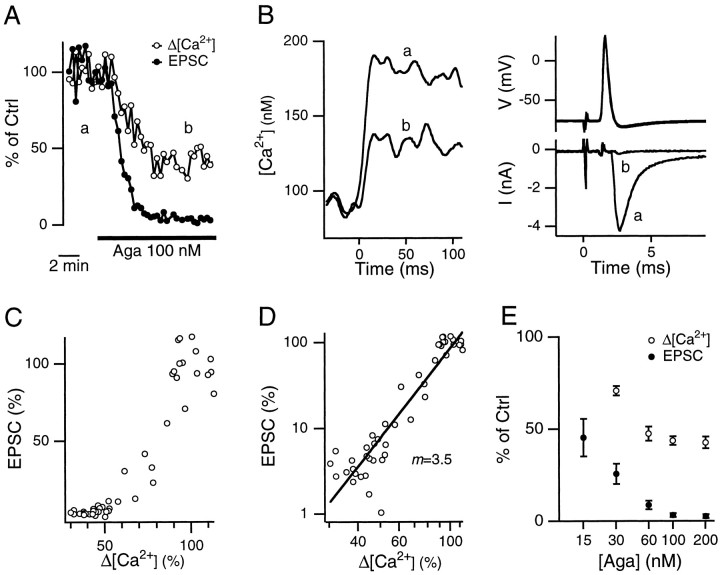
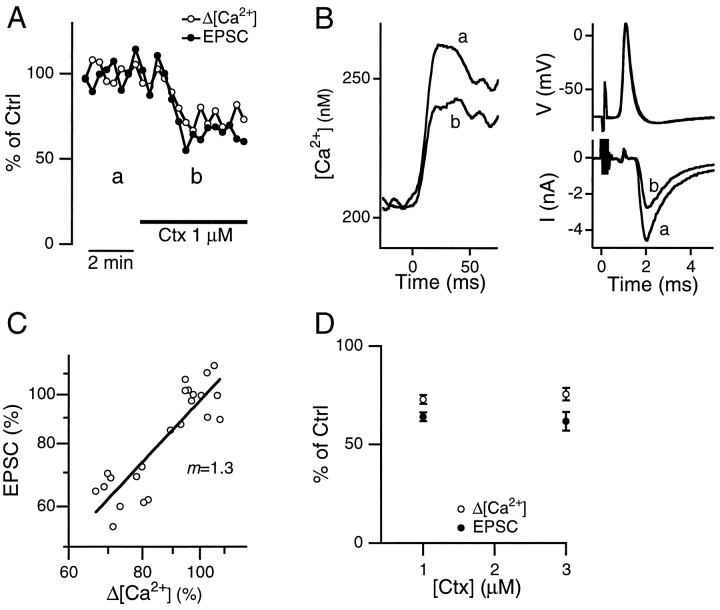
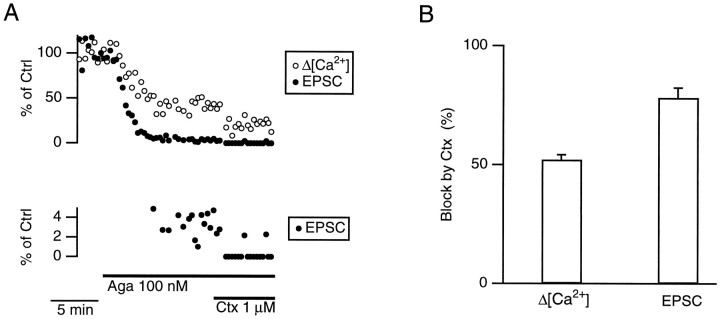
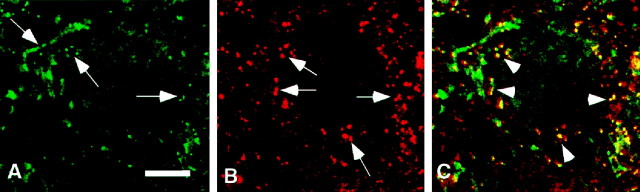
We studied how Ca2+ influx through different subtypes of Ca2+ channels couples to release at a calyx-type terminal in the rat medial nucleus of the trapezoid body by simultaneously measuring the presynaptic Ca2+ influx evoked by a single action potential and the EPSC. Application of subtype-specific toxins showed that Ca2+ channels of the P/Q-, N-, and R-type controlled glutamate release at a single terminal. The Ca2+ influx through the P/Q-type channels triggered release more effectively than Ca2+ influx through N- or R-type channels. We investigated mechanisms that contributed to these differences in effectiveness. Electrophysiological experiments suggested that individual release sites were controlled by all three subtypes of Ca2+ channels. Immunocytochemical staining indicated, however, that a substantial fraction of N- and R-type channels was located distant from release sites. Although these distant channels contributed to the Ca2+ influx into the terminal, they may not contribute to release. Taken together, the results suggest that the Ca2+ influx into the calyx via N- and R-type channels triggers release less effectively than that via P/Q-type because a substantial fraction of the N- and R-type channels in the calyx is localized distant from release sites.


Figures

Fig. 1.
Fig. 1.
Effect of Aga on presynaptic Δ[Ca2+] and EPSC. A, Aga (100 nm) reduced concurrently both the Δ[Ca2+] and the EPSC evoked by single presynaptic action potentials. The values of Δ[Ca2+] and of the EPSCs are given relative to their respective average values before application of the toxin.B, Sample traces of the presynaptic Ca2+ influx (left), the presynaptic action potential (top right), and the EPSC (bottom right) before (a) and after (b, as indicated in A) Aga application. The stimulus was given at time 0. Each trace was taken from a single sweep (same for all the following figures).C, D, EPSCs plotted against the Δ[Ca2+] from panel A on linear (C) and double logarithmic (D) scales. The slope of the linear regression line in D was 3.5. E, Summary of the dose-dependent effect of Aga on the Δ[Ca2+] and the EPSC (each value was obtained from three to nine cells).
Fig. 2.
Fig. 2.
Effect of Ctx on presynaptic Δ[Ca2+] and EPSC. A, Ctx (1 μm) reduced both the Δ[Ca2+] and the EPSC evoked by single presynaptic action potentials with a similar time course. Amplitudes of both the Δ[Ca2+] and the EPSC were normalized to the values during the control period.B, Sample traces of the presynaptic Ca2+ influx (left), the presynaptic action potential (top right), and the EPSC (bottom right) before (a) and after (b, as indicated in A) Ctx application. The stimulus was given at time 0. C, EPSCs plotted against the Δ[Ca2+] fromA on double logarithmic scales. The slope of the linear regression line was 1.3. D, Summary of the effect of Ctx on the Δ[Ca2+] and the EPSC. Each value was obtained from 3–11 cells. The effects of Ctx at 1 and 3 μm were not significantly different (p > 0.5; t test).
Fig. 3.
Fig. 3.
Presynaptic Ca2+ currents elicited by an action potential waveform command (ICa(AP)) before and after Ctx application. A, Application of Ctx (1 μm) reduced the ICa(AP). B, Sample traces of the ICa(AP) before (Ctrl) and after Ctx application, the latter of which was also scaled (Ctx scaled) for comparison with the Ctrl trace. C, TheIV relation before (Ctrl) and after Ctx application. The difference between these two IV curves yielded the Ctx-sensitive IV curve (Diff), which activated at potentials more positive than −30 mV. In contrast, the threshold for activation of Ctx-insensitive currents (Ctx) was at approximately −40 mV.D, Sample Ca2+ currents elicited by a 10 msec step pulse to −30 and 0 mV before (left) and after (right) Ctx application. Note that currents elicited at −30 mV did not change significantly after Ctx application.
Fig. 4.
Fig. 4.
Effect of Ctx on Δ[Ca2+] and EPSC in the presence of Aga. A, An experiment showing that Ctx (1 μm) reduced both the Δ[Ca2+] and the EPSC in the presence of Aga (100 nm). In the bottom panel, the EPSC is plotted on a different scale. If the maximum amplitude of the postsynaptic current was less than twice the SD of the baseline noise, the response was classified as a failure. B, In the presence of Aga (100 nm), the block (%) of the Δ[Ca2+] and of the EPSC by Ctx (1 μm) were significantly different (p < 0.01; paired t test). The percentages were normalized to the values immediately before Ctx application.
Fig. 5.
Fig. 5.
Effect of Ctx on EPSC after EGTA was dialyzed into the terminal. A, While the EPSC was recorded, a cell-attached recording was made on the presynaptic terminal with a pipette containing 10 mm EGTA. A suction pulse (arrow) was applied to establish the whole-cell configuration, allowing EGTA to diffuse from the pipette into the terminal. The EPSC decreased rapidly and reached a new baseline value. Ctx (1 μm) was then applied to the bath, which further decreased the EPSC. B, Comparison of the block of the EPSC by Ctx (1 μm) in the control (Ctrl; n = 10) and after EGTA (n = 5) was dialyzed into the presynaptic terminal. In both cases, the block was normalized to the value immediately before Ctx application.
Fig. 6.
Fig. 6.
Distribution of the α1 subunit of classes A, B, and E Ca2+ channels in synapses in the MNTB. A, B, Tissue section double-labeled using antibodies to the α1 subunit of class A Ca2+ channels (A,arrows) and anti-synaptotagmin (B), illustrating their distribution in the synapse surrounding neurons located in the MNTB. C, Merged image of A and B illustrating regions of colocalization (yellow;arrowheads) between the α1 subunit of class A Ca2+ channels (green) and synaptotagmin (red), demonstrating the presence of these channels at the release face of the synapse.D, E, Tissue section double-labeled using antibodies to the α1 subunit of class B Ca2+ channels (D,arrows) and anti-synaptotagmin (E), illustrating their distribution in the synapse surrounding MNTB neurons. F, Merged image of the staining observed in D and E, illustrating few regions of colocalization (yellow, arrowheads) between class B Ca2+ channels and synaptotagmin in the synapse and the presence of class B Ca2+ channels in other regions of the synapse. G, H, Tissue section double-labeled with antibodies to the α1 subunit of class E Ca2+ channels (G,arrows) and anti-synaptotagmin antibodies (H), illustrating the presence of synaptotagmin at the release face of the synapse and the distribution of class E channels at other sites in the synapse. I, Merged image of the staining shown in G andH, illustrating very few sites of colocalization (yellow) of these two proteins.Arrows illustrate sites of class E Ca2+ channels outside the release face of the synapse. Scale bars: AF, 10 μm;GI, 5 μm.
Fig. 7.
Fig. 7.
Double labeling of class A and class B Ca2+ channels in the MNTB.A, B, Double labeling of a tissue section from the MNTB using antibodies to the class B (A, arrows) and class A (B, arrows) α1 subunits of Ca2+ channels. C, Merged image of staining shown in A and B to illustrate regions of only class B staining (green), or regions of only class A staining (red) and regions of colocalization (yellow,arrowheads) of these two channels in the synapses and neurons located in the MNTB. Scale bar:AC, 10 μm.
Fig. 8.
Fig. 8.
A schematic view of the distribution of Ca2+ channels in the calyx of Held (not drawn to scale). Within a release site, three subtypes of channels, P/Q-, N-, and R-type channels are equally close to the docked vesicle. The local Ca2+ domains created by the opening of channels overlap within the release site. Some Ca2+ channels, labeled as “distant Ca2+ channel”, are located so far from this or other release sites that their Ca2+ domains do not contribute to release. A larger fraction of N- and R-type than P/Q-type channels are distant Ca2+ channels.

References

    1. Artalejo CR, Adams ME, Fox AP. Three types of Ca2+ channel trigger secretion with different efficacies in chromaffin cells. Nature. 1994;367:72–76. - PubMed
    1. Augustine GJ, Adler EM, Charlton MP. The calcium signal for transmitter secretion from presynaptic nerve terminals. Ann NY Acad Sci. 1991;635:365–381. - PubMed
    1. Borst JGG, Sakmann B. Calcium influx and transmitter release in a fast CNS synapse. Nature. 1996;383:431–434. - PubMed
    1. Borst JGG, Sakmann B. Calcium current during a single action potential in a large presynaptic terminal of the rat brainstem. J Physiol (Lond) 1998;506:143–157. - PMC - PubMed
    1. Borst JGG, Sakmann B (1999) Effect of changes in action potential shape on calcium currents and transmitter release in a calyx-type synapse of the rat auditory brainstem. Philos Trans R Soc Lond B Biol Sci, in press. - PMC - PubMed

Publication types

MeSH terms

LinkOut - more resources