. 1999 Jan 15;19(2):759-74.
doi: 10.1523/JNEUROSCI.19-02-00759.1999.

Identification and characterization of early glial progenitors using a transgenic selection strategy

Affiliations

Identification and characterization of early glial progenitors using a transgenic selection strategy

K J Chandross et al. J Neurosci. .

Abstract

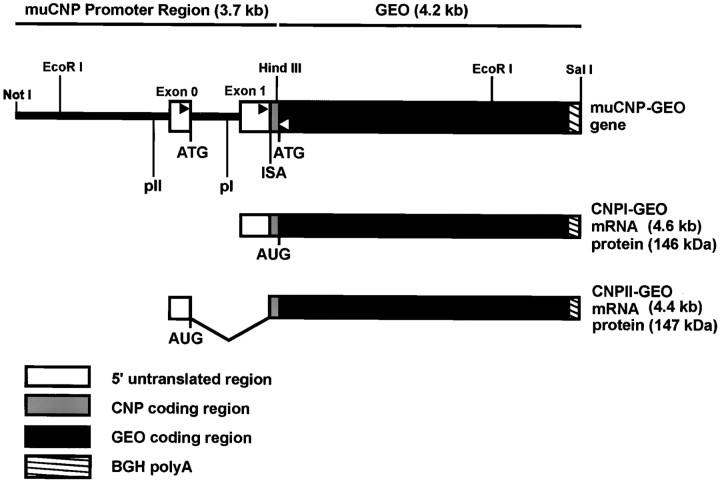
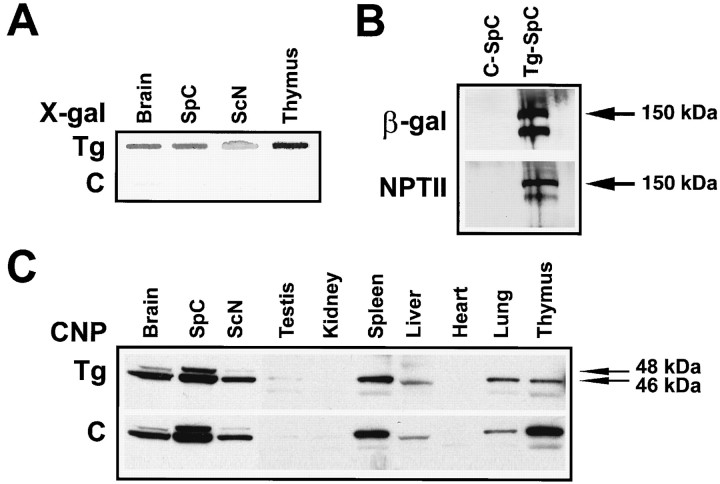
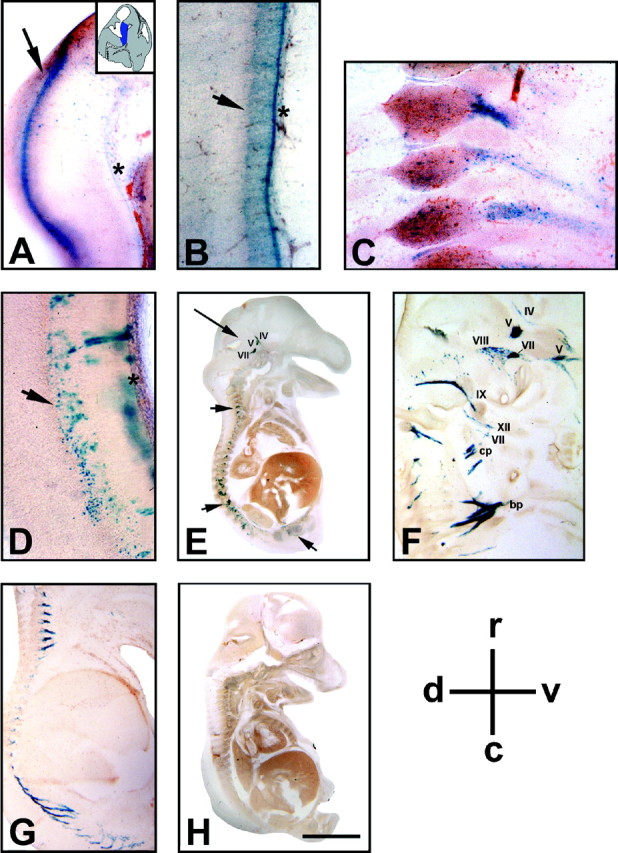
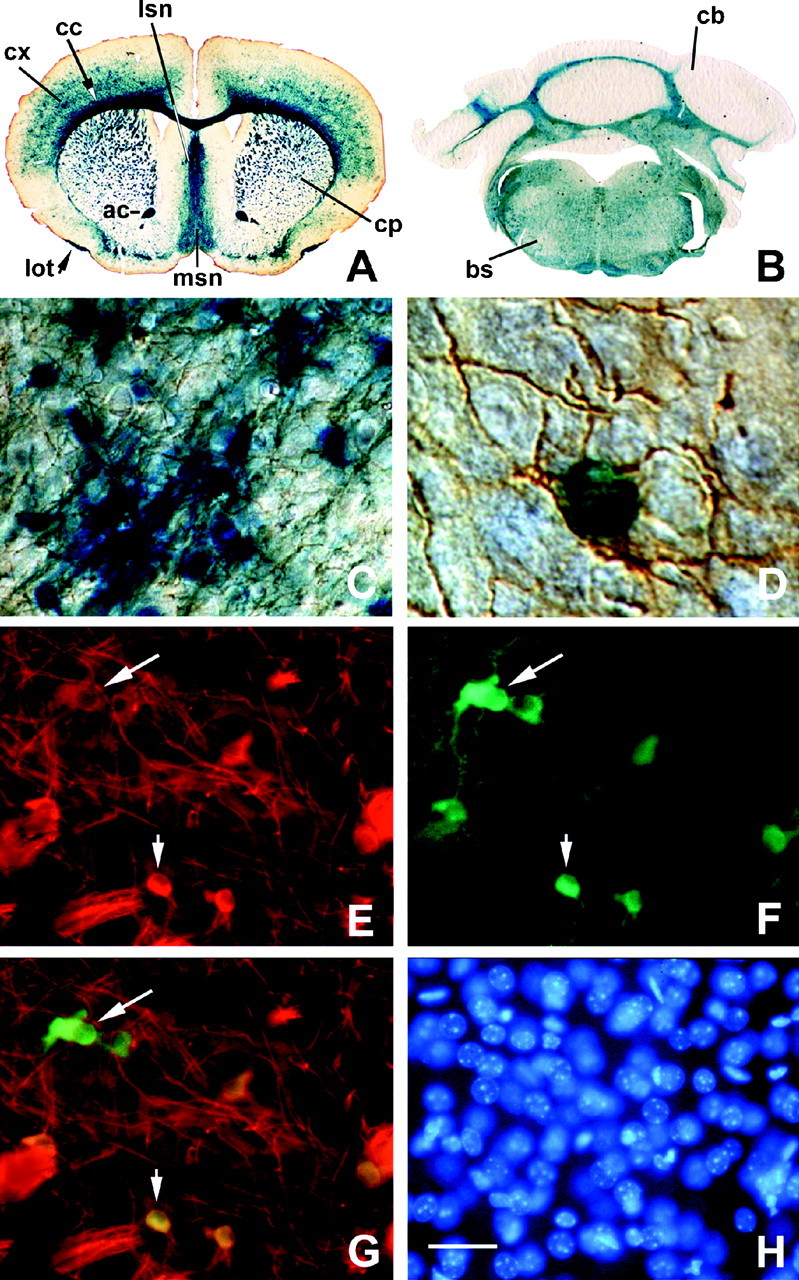
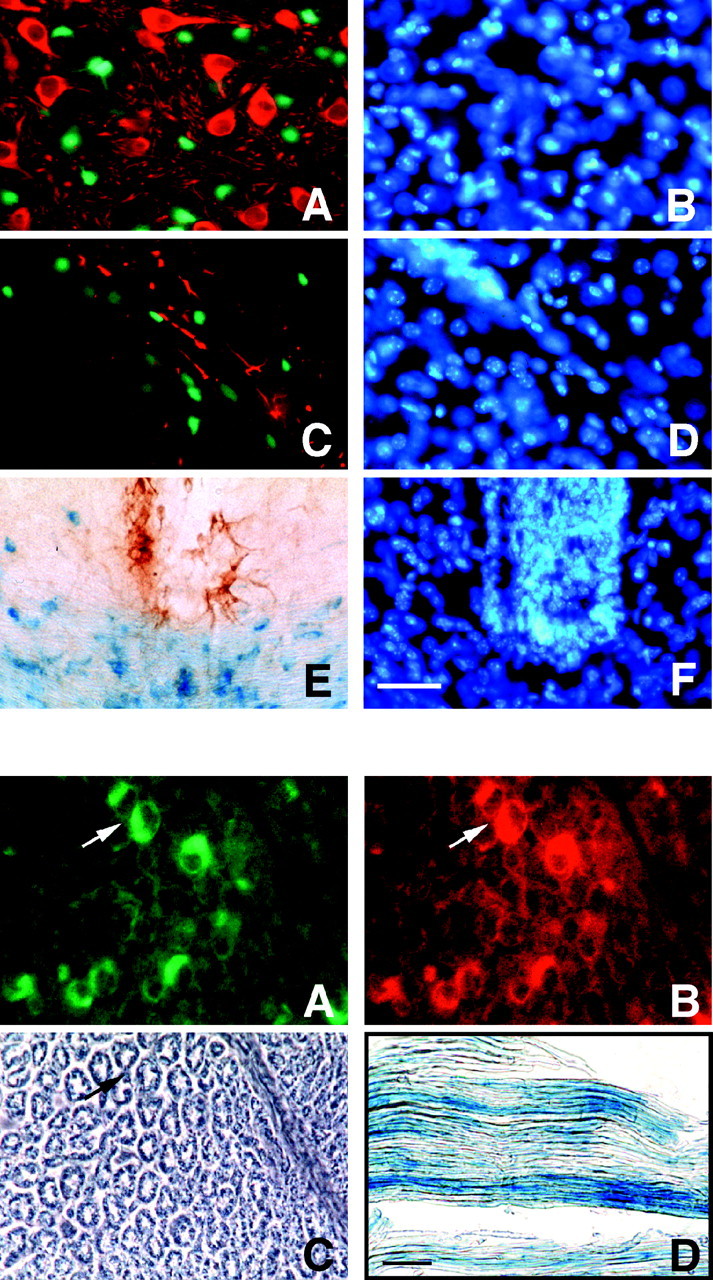
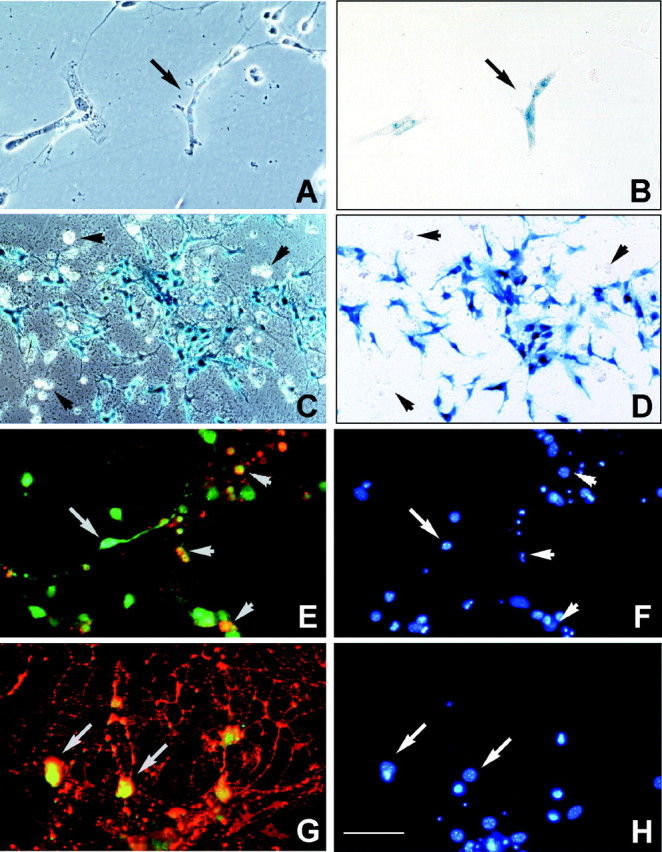
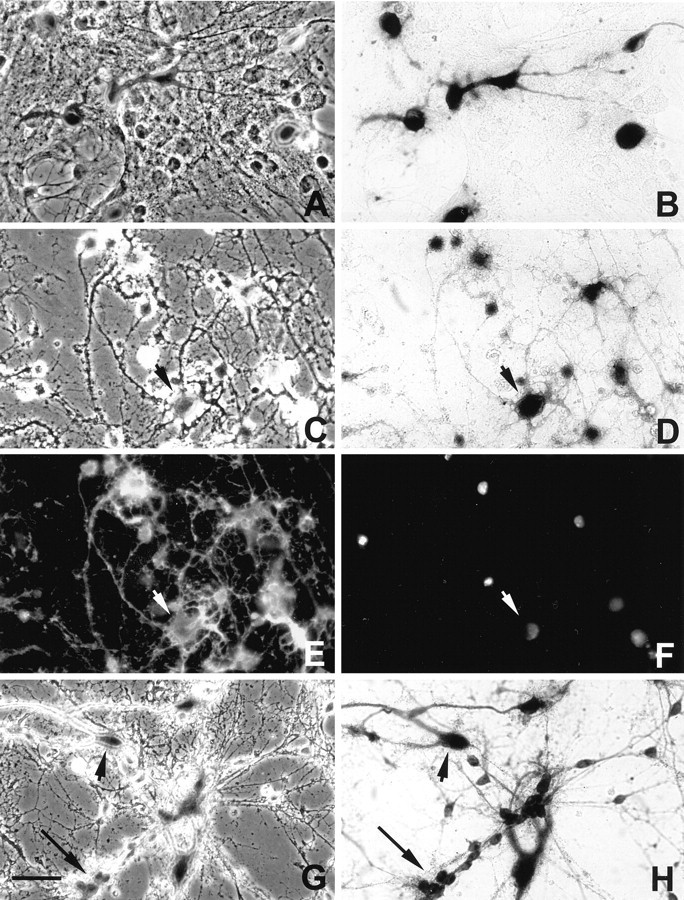
To define the spatiotemporal development of and simultaneously select for oligodendrocytes (OLs) and Schwann cells (SCs), transgenic mice were generated that expressed a bacterial beta-galactosidase (beta-gal) and neomycin phosphotransferase fusion protein (betageo) under the control of murine 2'3'-cyclic nucleotide 3'-phosphodiesterase (muCNP) promoters I and II. Transgenic beta-gal activity was detected at embryonic day 12.5 in the ventral region of the rhombencephalon and spinal cord and in the neural crest. When cells from the rhombencephalon were cultured in the presence of G418, surviving cells differentiated into OLs, indicating that during development this brain region provides one source of OL progenitors. Postnatally, robust beta-gal activity was localized to OLs throughout the brain and was absent from astrocytes, neurons, and microglia or monocytes. In the sciatic nerve beta-gal activity was localized exclusively to SCs. Cultures from postnatal day 10 brain or sciatic nerve were grown in the presence of G418, and within 8-9 d exposure to antibiotic, 99% of all surviving cells were beta-gal-positive OLs or SCs. These studies demonstrate that the muCNP-betageo transgenic mice are useful for identifying OLs and SCs beginning at early stages of the glial cell lineage and throughout their development. This novel approach definitively establishes that the beta-gal-positive cells identified in vivo are glial progenitors, as defined by their ability to survive antibiotic selection and differentiate into OLs or SCs in vitro. Moreover, this experimental paradigm facilitates the rapid and efficient selection of pure populations of mouse OLs and SCs and further underscores the use of cell-specific promoters in the purification of distinct cell types.


Figures

Fig. 1.
Fig. 1.
Schematic illustration of the muCNP-βgeo construct used to generate Tg mice. The muCNP-βgeo construct was made by ligating the NotI and HindIII fragment of the muCNP promoter region, containing promoters I and II, to theNotI and HindIII sites of the pBKSβgeo reporter gene encoding a protein with both β-gal and neomycin phosphotransferase activity. The regions to which primers were made for the reverse transcription-PCR are marked withblack (upstream) and white (downstream)arrowheads. The internal splice acceptor (ISA) and the ATG translational start sites are indicated. pI, muCNP promoter I; pII, muCNP promoter II.
Fig. 2.
Fig. 2.
Southern blot analysis of the cgeo 1 Tg line.A, PhosphorImager analysis ofEcoRI-digested genomic DNA (stained with ethidium bromide B). EcoRI cut the transgene twice, producing a 6 kb band in Tg that was not detected in non-Tg mice, using the βgeo probe. One asterisk indicates heterozygous; two asterisks indicate homozygous, and the absence of asterisks indicates a non-Tg sibling. F0, founder; F1, F1 generation; F2, F2 generation. C, The integrated volume for the 6 kb Tg radioactive band for each sample was divided by the integrated volume value for the total DNA in the lane, and the resulting ratios were plotted. D, Total RNA was extracted from the brains of P21 Tg mice or non-Tg littermates, and the level of expression of CNP I, CNP II, CNP I-βgeo, or CNP II-βgeo was analyzed by reverse nscription-PCR. The endogenous CNP I and CNP II sequences were amplified in both the Tg and non-Tg samples, as shown by a positive band at ∼800 bp. By contrast, the CNP I-βgeo (83 bp) and CNP II-βgeo (73 bp) sequences were present only in Tg mice. Reactions run in the absence of reverse transcriptase (−RT) showed no amplified band.
Fig. 3.
Fig. 3.
Immunoblot analyses on tissue from Tg and non-Tg mice. A, Total protein (700 μg) was transferred from a P55 Tg mouse to a nylon membrane and incubated with X-Gal. The brain, spinal cord, sciatic nerve, and thymus showed greatly increased β-gal activity compared with the same tissue from non-Tg siblings.B, To examine the presence of the βgeo fusion protein in Tg animals, 12 μg of total protein from P21 Tg or non-Tg sibling animals was resolved on a 7.5% acrylamide gel, electrotransferred, and probed for both β-gal and NPT II. The blots were processed for chemiluminescent detection and exposed to film for 10 min. Using either β-gal or NPT II antibodies, immunoreactive bands, corresponding to the appropriate size for the βgeo fusion protein (∼150 kDa), were found only in Tg spinal cord and were absent from control tissue.C, When blots were probed for CNP, protein levels were similar in both Tg and control mouse tissues. Blots were exposed for 10 sec (brain, spinal cord, and sciatic nerve) and 1 hr (testis, kidney, spleen, liver, heart, lung, and thymus). Horizontal arrows delineate approximate molecular weights.C, Non-Tg littermate control; ScN, sciatic nerve; SpC, spinal cord. Similar results were observed in four independent experiments.
Fig. 4.
Fig. 4.
LacZ staining in muCNP-βgeo embryos. A–C, Whole-mount sagittal sections from E12.5 Tg embryos. A, In the brain, β-gal activity was found in the ventral regions of the rhombencephalon (arrow, asterisk; this region corresponds to the blue area depicted in the inset). B, In the spinal cord, lacZ-positive cells were evident in the ventral (arrowhead) and floor plate (asterisk) regions. C, In the PNS, blue cells were present in neural crest cells surrounding and projecting ventrally off the spinal cord ganglia. D–H, Whole-mount sagittal sections from E15 Tg mice. D, Transgene activity was present in the lower thoracic spinal cord in the ventral (arrowhead) and floor plate (asterisk) regions. In the PNS, transgene activity was found in cranial nerves (E, long arrow, F) and peripheral nerve projections (E, arrowheads, F, G).H, Whole-embryo X-gal staining of a non-Tg E15 sibling showed no endogenous β-gal activity. Cranial nerves:V, trigeminal; VII, facial;VIII, vestibulocochlear; IX, glossopharyngeal; XII, hypoglossal. Cervical nerves:bp, brachial plexus; cp, cervical plexus. Sections were 200-μm-thick. Scale bars: A, 350 μm;B, D, 700 μm; C, 250 μm; E, H, 3.0 mm; F, 900 μm; G, 2.0 mm. Similar results were seen in three embryos per time point, each using different mating pairs.
Fig. 5.
Fig. 5.
Tg β-gal staining in oligodendrocytes in vivo. X-gal staining (blue) of 40-μm-thick coronal sections from cortex (A), brainstem (B), and cerebellum of a P21 mouse showed β-gal activity throughout CNS white matter tracts. Higher-power magnifications of muCNP-βgeo promoter activity in the cortex (C) and in an individual cell (D) demonstrated that β-gal activity (blue) was localized to CNP-positive (brown) OLs. Note that the cell bodies and arborized processes of the CNP- and X-gal-positive cells are characteristic of OLs. Indirect immunofluorescence of a section double-labeled with CNP-specific (E) and β-gal-specific (F) antibodies demonstrated co-localization of these two antigens within the same cells (arrow, arrowhead). G, Overlay of the β-gal and CNP double immunostaining shown in E and F.H, DAPI staining of the individual cell nuclei in the section shown in E–G. Scale bars: A, 1.6 mm; B, 800 μm; C, E–H, 40 μm; D, 10 μm. ac, Anterior commissure; bs, brainstem; cb, cerebellum; cc, corpus callosum; cp, caudate putamen; cx, cortex; lot, lateral olfactory tract; lsn, lateral septal nucleus;msn, medial septal nucleus. Similar results were seen in five independent preparations.
Fig. 6.
Fig. 6.
Tg β-gal activity in neurons, astrocytes, and microglia in vivo. Forty-micrometer-thick coronal sections from the brains of P21 mice were double-stained with either the β-gal substrate CMFDG or X-gal and NSE, GFAP, or ED1-specific antibodies. CMFDG (A, C, fluorescent green) orlacZ (E, blue) staining did not co-localize to (A) NSE-positive neurons (A, fluorescent red), GFAP-positive astrocytes (C, fluorescent red), or ED1-positive microglia or monocytes (brown) in the cerebrum. B, D, F, DAPI staining (fluorescent blue) of individual cell nuclei in A, C, and D, respectively. Top, Dorsal; bottom, ventral. A, B, Caudate putamen; C, D, corpus callosum; E, F, brainstem just below fourth ventricle. Scale bar, 50 μm. Similar results were seen in five independent preparations.
Fig. 8.
Fig. 8.
In vitro selection and antigenic characterization of transgene positive-cells from E12.5 rhombencephalon. A, B, Phase-contrast (A) and corresponding bright-field (B) photomicrographs of dissociated rhombencephalon cultures showing lacZ-positive staining (arrow) after 3 d in culture and 48 hr exposure to G418. C, D, Phase-contrast (C) and corresponding bright-field (D) photomicrographs of cells taken after 9 d exposure to G418, demonstrating that most of the surviving cells were β-gal-positive. Transgene-negative cells were round and phase-bright in appearance (C, D, arrowheads), and many lacked an identifiable cell nucleus (red cells; E, F, top right). Double immunostaining showed that (E) β-gal-positive cells were A2B5-negative (E, green cells, arrow) or A2B5-positive (E, yellow, arrowheads). Additionally, many cells were positive for both β-gal and O1 (G, yellow fluorescence). F, H, DAPI staining of the individual cell nuclei shown in E andG, respectively. Scale bar: A, B, E–J, 50 μm; C, D, 90 μm. Similar results were seen in two independent preparations.
Fig. 9.
Fig. 9.
In vitro selection of transgene-positive oligodendrocytes in P10 Tg mice. A,B, Phase-contrast (A) and corresponding bright-field (B) photomicrographs of dissociated brain cultures 24 hr after plating. The heterogeneous cellular fraction contained lacZ-positive cells (blue) that were round to spindle-shaped cells and contained few extended processes. After 12 d exposure to 180 μg/ml G418, surviving cells were positive for bothlacZ (C, phase-contrast;D, bright-field) and, using indirect immunfluorescent microscopy, CNP (E). F, DAPI staining of individual nuclei within the same field asC–E confirmed cell number. In the presence of B104-conditioned media, many cells contained multipolar processes (C–F, arrowheads). G, H, Phase-contrast (G) and bright-field (H) G418-selected cultures grown in the presence of astrocyte-conditioned media contained β-gal-positive progenitor cells (arrow) with bipolar processes and more differentiated cells (arrowhead). Scale bar, 50 μm. Similar results were seen in six independent preparations.
Fig. 10.
Fig. 10.
In vitro selection of transgene-positive Schwann cells in P10 muCNP-βgeo mice. (A) Before selection, the phase-contrast photomicrograph shows that cultures contained Schwann cells (arrowhead; spindle-shaped, bipolar cells) and fibroblasts (arrow; flat, multipolar cells).B–D, Within 3 d of exposure to 360 μg/ml G418, SCs were positive, whereas fibroblasts (B–D, arrow) were negative for CMFDG (C). D, The corresponding field from A and B, stained with DAPI, demarcates individual cell nuclei.E–H, At 12 d of exposure to G418 (E, phase-contrast), surviving cells were positive for both CMFDG (F, fluorescent micrograph) and S-100 (G, fluorescent micrograph). H, Corresponding field from E–G, stained with DAPI, demarcates individual cell nuclei. Scale bar, 50 μm. Similar results were seen in three independent preparations.

References

    1. Abney ER, Williams BP, Raff MC. Tracing the development of oligodendrocytes from precursor cells using monoclonal antibodies, fluorescence-activated cell sorting and cell culture. Dev Biol. 1983;100:166–171. - PubMed
    1. Bachmair A, Finley D, Varshavsky A. In vivo half-life of a protein is a function of its amino-terminal residue. Science. 1986;234:179–186. - PubMed
    1. Barres BA, Chun LLY, Corey DP. Ion channel in vertebrate glia. Annu Rev Neurosci. 1988;13:441–474. - PubMed
    1. Barres BA, Hart IK, Coles HSR, Burne JF, Voyvodic JT, Richardson WD, Raff MC. Cell death and control of cell survival in the oligodendrocyte lineage. Cell. 1992;70:31–46. - PubMed
    1. Bernier L, Alvarez F, Norgard EM, Raible DW, Mentaberry A, Schembri JG, Sabatini DD, Colman DR. Molecular cloning of a 2′,3′-cyclic nucleotide 3′-phosphodiesterase: mRNAs with different 5′-ends encode the same set of proteins in nervous and lymphoid tissues. J Neurosci. 1987;7:2703–2710. - PMC - PubMed

Publication types

MeSH terms