. 1999 Jan 15;19(2):783-93.
doi: 10.1523/JNEUROSCI.19-02-00783.1999.

Lhx9: a novel LIM-homeodomain gene expressed in the developing forebrain

Affiliations

Lhx9: a novel LIM-homeodomain gene expressed in the developing forebrain

S Rétaux et al. J Neurosci. .

Abstract

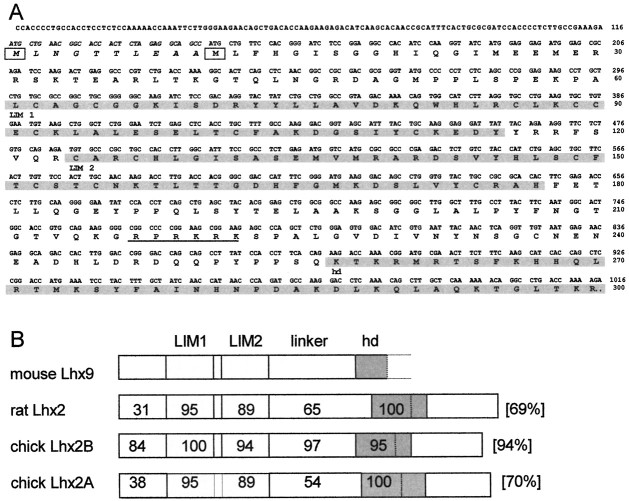
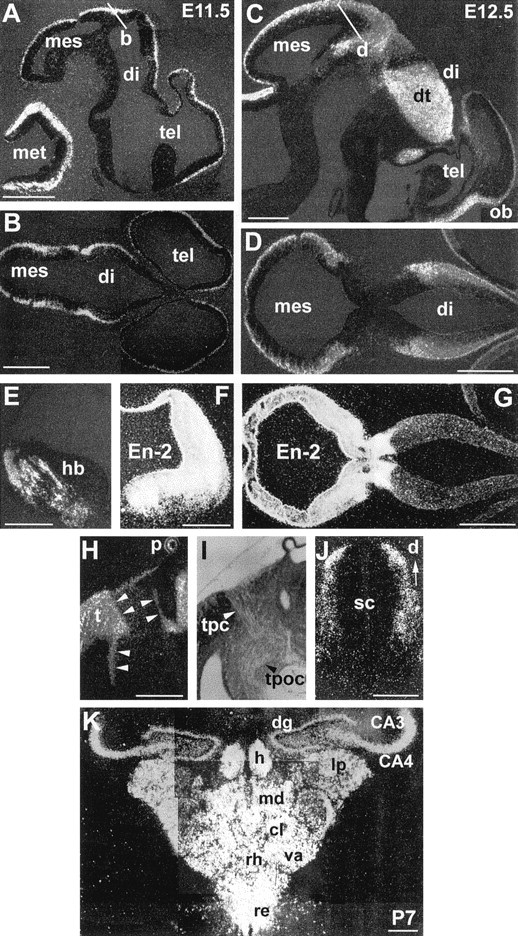
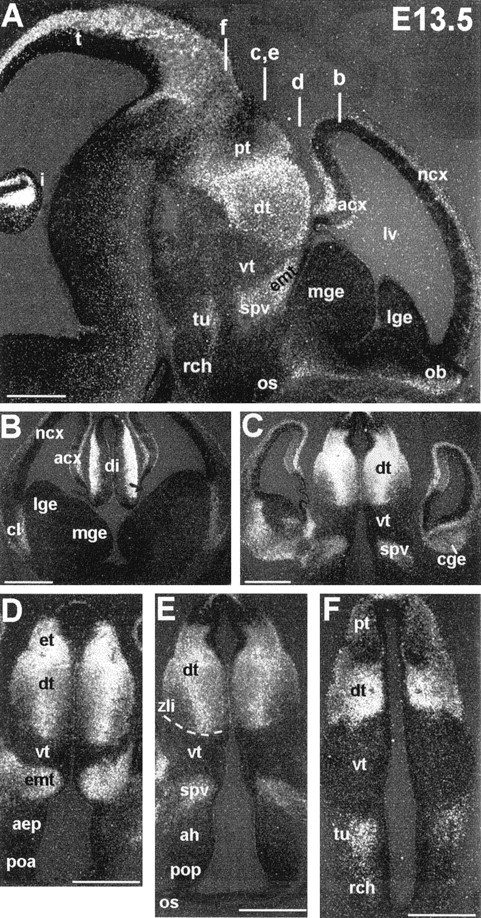
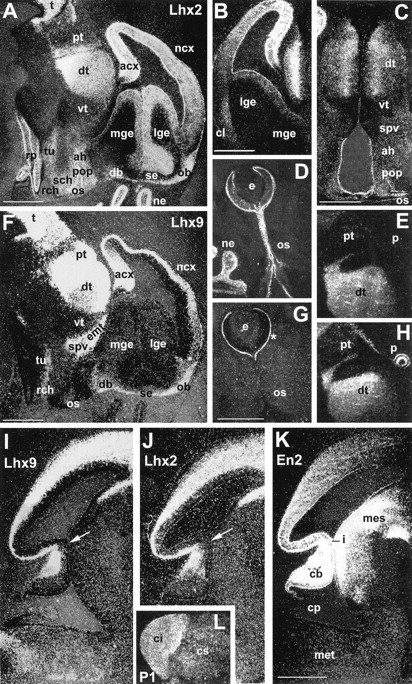
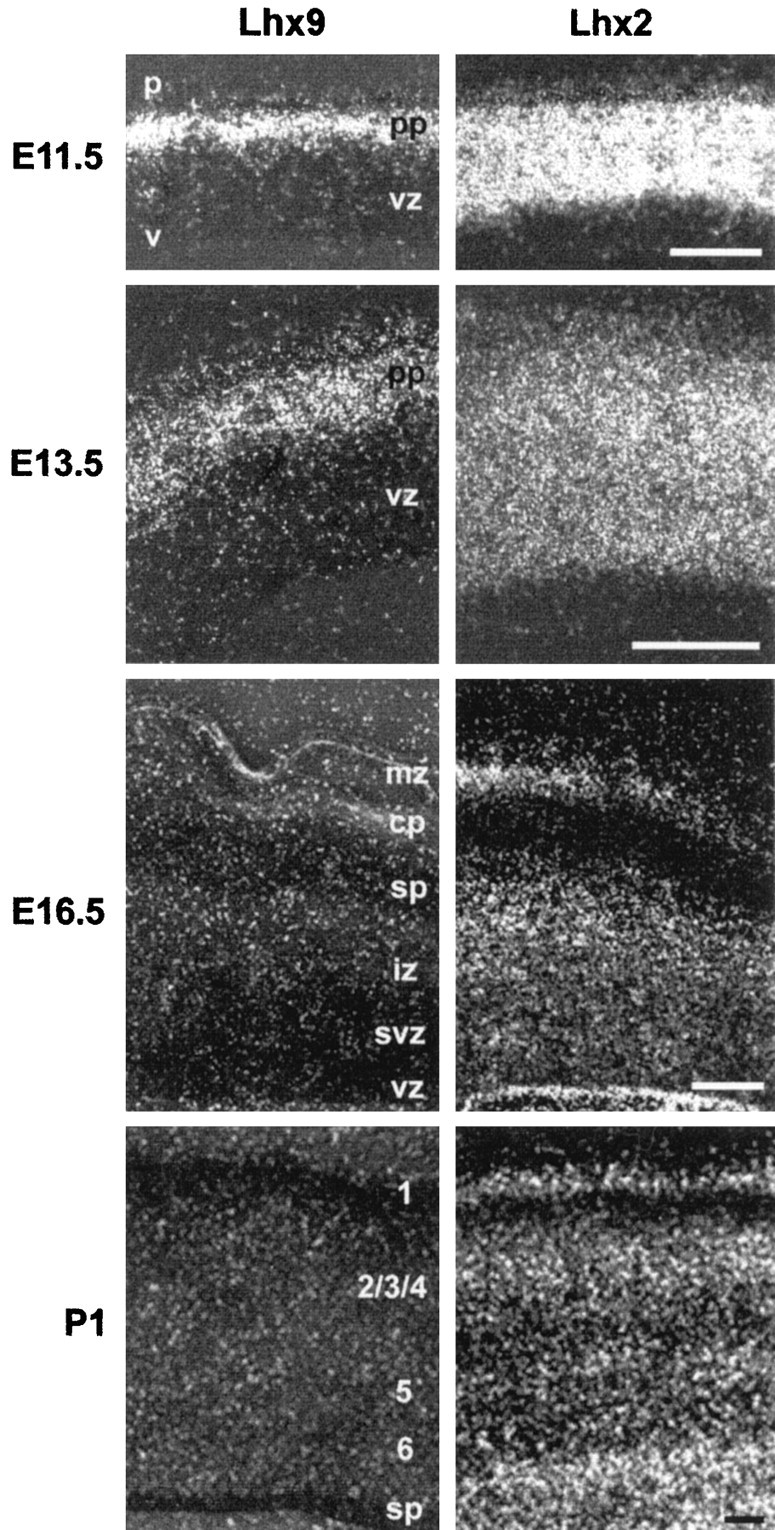
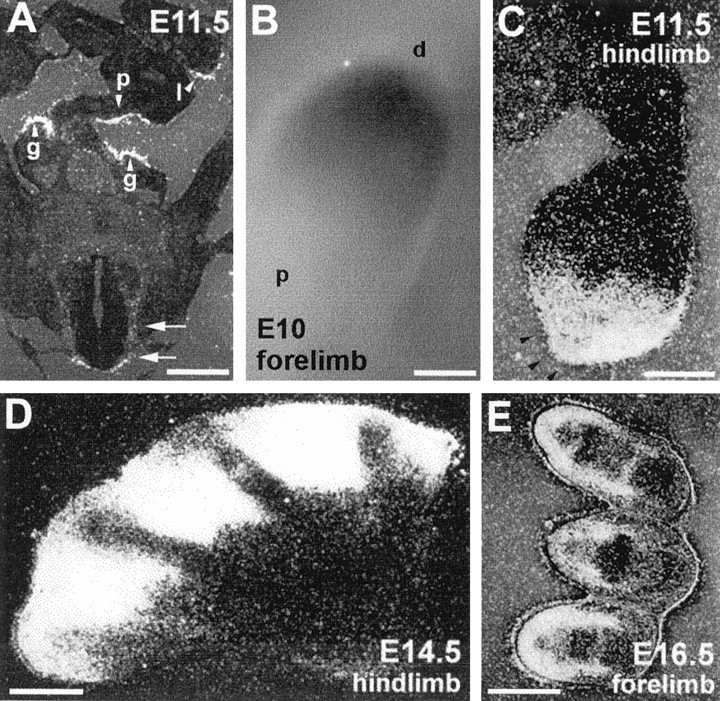
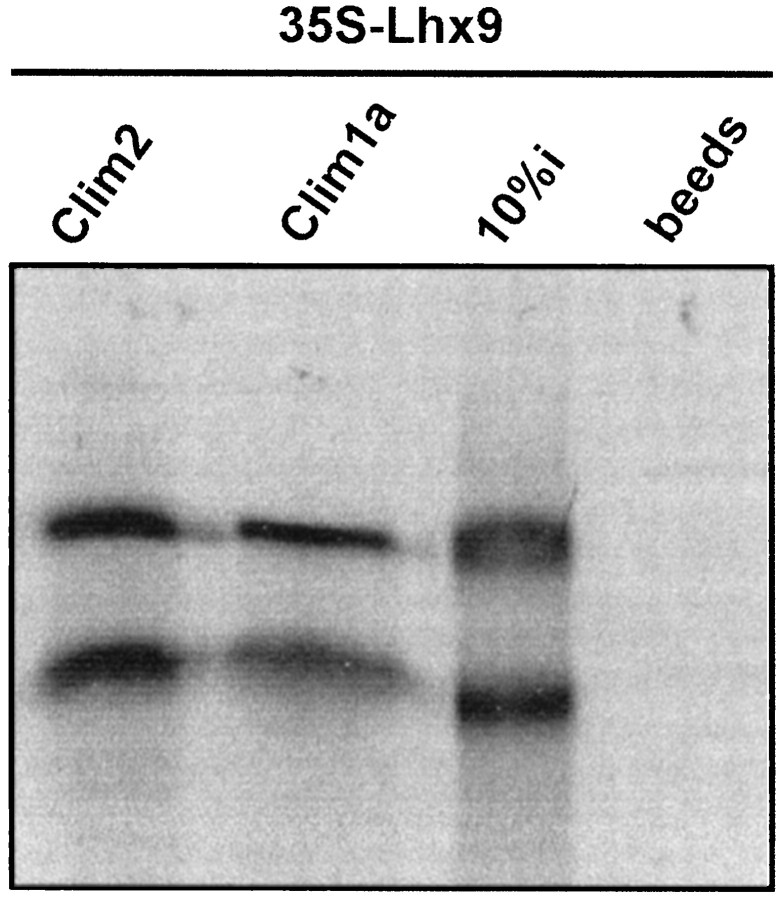
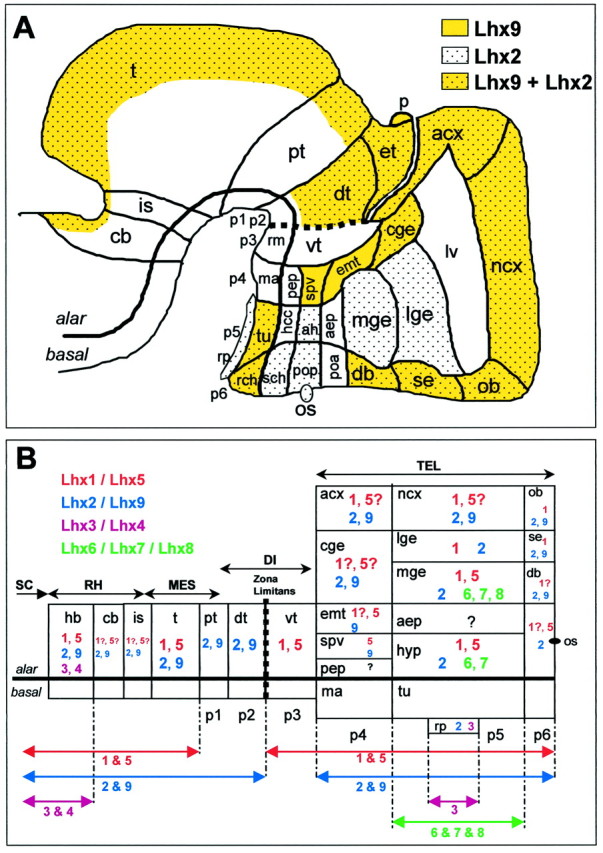
A novel LIM-homeodomain gene, Lhx9, was isolated by degenerate RT-PCR followed by mouse embryonic library screening. Lhx9 cDNA encodes a protein that is most closely related to Drosophila apterous and rodent Lhx2 proteins. The Lhx9 spatiotemporal pattern of expression during embryogenesis was similar but distinct from Lhx2. Highest expression levels were found in the diencephalon, telencephalic vesicles, and dorsal mesencephalon. Domains of expression respected the proposed neuromeric boundaries (). Lhx9 was also expressed in the spinal cord, forelimb and hindlimb mesenchyme, and urogenital system. Although Lhx9 expression was sustained in diencephalon and mesencephalon from embryonic day 10.5 (E10.5) to postnatal stages, it was transient in the future cerebral cortex, where it was turned off between E14.5 and E16.5. Lhx9 expression was highest if not exclusively located (depending on the region of interest) in the intermediate and mantle zones, as opposed to the mitotic ventricular zone. Lhx9 protein was tested for interaction with the recently discovered cofactors of LIM-homeodomain proteins and was found to interact strongly both with CLIM1 and CLIM2. The expression pattern and structural characteristics of Lhx9 suggest that it encodes a transcription factor that might be involved in the control of cell differentiation of several neural cell types. Furthermore, Lhx9 protein could act in a combinatorial manner with other LIM-homeodomain factors expressed in overlapping pattern.


Figures

Fig. 1.
Fig. 1.
Sequence of murine Lhx9.A, Nucleotide and deduced amino acid sequence ofLhx9. Amino acids are indicated by single-letter code. The two in-frame ATG start codons areboxed. The sequence between the two possible start codons is in italics solely to indicate that based on homology with Lhx2, the second one is more likely to be used. LIM1, LIM2, and the hd are indicated by shading. The putative nuclearization signal is underlined.B, Comparison of murine Lhx9 with rat and chick Lhx2. The percentage of identity in each domain between gene products is indicated. GenBank/EMBL accession numbers: L06804 (rat Lhx2), L35566(chick Lh2B), and AB005882 (chick Lh2A).
Fig. 2.
Fig. 2.
Lhx9 expression on brain sections from E11.5 (A, B), E12.5 (C–E, J), E13.5 (H, I), and P7 (K) embryos and comparison withEn-2 (F, G) on dark-field illumination photomicrographs. In this and subsequent figures, pictures are oriented so that anterior is right and dorsal is at thetop. A, C, Parasagittal sections through the entire brain at indicated stages. B, D, Horizontal sections (level and orientation indicated by white barsin A, C, respectively). G,En-2 expression on a section adjacent to that shown inD. E, F, Adjacent coronal hemisections showing the comparison of Lhx9 (E) and En-2 (F) expression in the anterior hindbrain. H, I, Bright-field (I) and dark-field (H) views of the same area showing the correlation between the position of the tpc and the tract of the postoptic commissure (tpoc) and Lhx9sharp boundaries of expression (arrowheads).J, Coronal section through the spinal cord.K, Coronal section at the level of the hippocampus and thalamus at P7, showing expression in CA3, CA4, and the dentate gyrus (dg) and the delineation of various thalamic nuclei by Lhx9 hybridization signal. cl, Central lateral; hr, habenula; lp, lateral posterior; md, mediodorsal; va, ventral anterior; re, reuniens; rh, rhomboid. See Table 1 for anatomical abbreviations. Scale bars:A–I, K, 100 μm; J, 50 μm.
Fig. 3.
Fig. 3.
Lhx9 expression at E13.5.A, Sagittal section through the entire brain.B–F, coronal sections through the telencephalon and diencephalon (plan of section indicated by white bars inA) showing Lhx9 transverse boundaries in the rostrocaudal extension. The dotted line indicates the zli. Scale bars, 100 μm. See Table 1 for anatomical abbreviations.
Fig. 4.
Fig. 4.
Comparison of Lhx2 (A–E, J),Lhx9 (F–I, L), and En-2(K) expression on sections. A, F, Parasagittal adjacent sections through the entire brain at E14.5, comparing expression of Lhx2 (A) and Lhx9 (F). B, C, Coronal sections at E13.5 showing Lhx2 expression in the telencephalon and diencephalon. Sections are adjacent to those shown in Figure 3, B and E, respectively, for comparison of transverse boundaries. D, G, Horizontal adjacent sections showing Lhx2 (D) and Lhx9 (G) expression in the eye and optic stalk at E14.5. The asterisk inG points to the nonspecific signal attributable to the presence of the eye pigmented epithelium. E, H, Adjacent parasagittal section showing Lhx2(E) and Lhx9(H) in the dorsal diencephalon and pretectum at E13.5. Note the absence of Lhx2 in the pineal gland.I–K, Adjacent parasagittal sections at E13.5 to compareLhx9 (I),Lhx2 (J), and En-2(K) expression through the mesencephalon and metencephalon. Arrows in I andJ show the thinning of expression at the isthmus.L, Sagittal section through the midbrain of a P1 animal to show the Lhx9 sharp boundary between the superior and the inferior colliculi. Compare with I (earlier stage). Scale bars, 100 μm. ne, Nasal epithelium. See Table 1for abbreviations.
Fig. 5.
Fig. 5.
Comparison of Lhx9(left) and Lhx2 (right) expression in the neocortical epithelium at indicated stages. The pial surface (p) is at the top, and the ventricular surface (v) is at thebottom. Left and rightphotographs were taken on adjacent sections. cp, Cortical plate; iz, intermediate zone;mz, marginal zone; pp, preplate;sp, subplate; svz, subventricular zone;vz, ventricular zone. Scale bars, 100 μm.
Fig. 6.
Fig. 6.
Lhx9 expression in limbs and urogenital ridge. A, Coronal section through the caelomic cavity and the spinal cord (double arrow) at E11.5. Arrowheads point to the developing gonads (g), pancreas (p), and liver (l). Because sex discrimination is not easy at this stage, it should be noted that the same expression pattern was found in all embryos examined. B, Expression in E10 forelimb after in toto in situ hybridization.p, Proximal; d, distal.C–E, Transverse sections through developing hindlimbs and forelimbs at indicated stages. Arrowheads inC indicate absence of expression in the apical ectodermal ridge. See Results for details. Scale bars: A, C–E, 50 μm; B, 200 μm.
Fig. 7.
Fig. 7.
Lhx9 interacts with CLIM1 and CLIM2. Autoradiogram of a representative GST pull-down assay in which35S-labeled, in vitro-translated Lhx9 was tested for its ability to bind bacterially expressed GST fusions of CLIM1 and CLIM2. Ten percent (10%i) of the total35S-labeled protein input and binding to beads alone are shown.
Fig. 8.
Fig. 8.
Summary of Lhx9 andLhx2 expression patterns in the context of the neuromeric model (A) and schematic representation of Lhx combinatorial expression in the developing brain (B). Adapted from Puelles and Rubenstein (1993).A, Schematic E13.5 brain shows similarities, differences, and boundaries of expression of Lhx9(yellow) and Lhx2(dotted). Expression in the ventral mesencephalon and metencephalon is not indicated because of its rather “nuclear-like” pattern. B, Compilation of expression data forLhx1/5 (red; Sheng et al., 1997), Lhx2/9 (blue; this paper),Lhx3/4 (pink; Li et al., 1994;Bach et al., 1995), and Lhx6/7/8(green; Matsumoto et al., 1996; Grigoriou et al., 1998) on a “flattened brain” adapted from Bulfone et al. (1993). Gene expression is indicated by color-coded numbers, and a possible Lhx combinatorial code clearly emerges. The anteroposterior extension of expression is recapitulated byarrows at the bottom. Basal plate expression is not indicated. The zli is indicated by a dotted line. p1–p6, Prosomeres 1–6. See Table 1 for anatomical abbreviations.

References

    1. Agulnick AD, Taira M, Breen JJ, Tanaka T, Dawid IB, Westphal H. Interactions of the LIM-domain-binding factor Ldb1 with LIM homeodomain proteins. Nature. 1996;384:270–272. - PubMed
    1. Angevine JB, Sidman RL. Autoradiographic study of cell migration during histogenesis of cerebral cortex in the mouse. Nature. 1961;192:766–768. - PubMed
    1. Bach I, Rhodes SJ, PearseII RV, Heinzel T, Gloss B, Scully KM, Sawchenko PE, Rosenfeld MG. P-Lim, a LIM homeodomain factor, is expressed during pituitary organ and cell commitment and synergizes with Pit-1. Proc Natl Acad Sci USA. 1995;92:2720–2724. - PMC - PubMed
    1. Bach I, Carriere C, Ostendorff HP, Andersen B, Rosenfeld MG. A family of LIM domain-associated cofactors confer transcriptional synergism between LIM and Otx homeodomain proteins. Genes Dev. 1997;11:1370–1380. - PubMed
    1. Barnes JD, Crosby JL, Jones MC, Wright CVE, Hogan BL. Embryonic expression of Lim-1, the mouse homolog of Xenopus XLIM-1, suggests a role in lateral mesoderm differentiation and neurogenesis. Dev Biol. 1994;161:168–178. - PubMed

Publication types

MeSH terms

Associated data