Clinical Trial
. 1999 Feb 1;514 ( Pt 3)(Pt 3):895-903.
doi: 10.1111/j.1469-7793.1999.895ad.x.

Comparison of intracortical inhibition and facilitation in distal and proximal arm muscles in humans

Affiliations
Clinical Trial

Comparison of intracortical inhibition and facilitation in distal and proximal arm muscles in humans

G Abbruzzese et al. J Physiol. .

Abstract

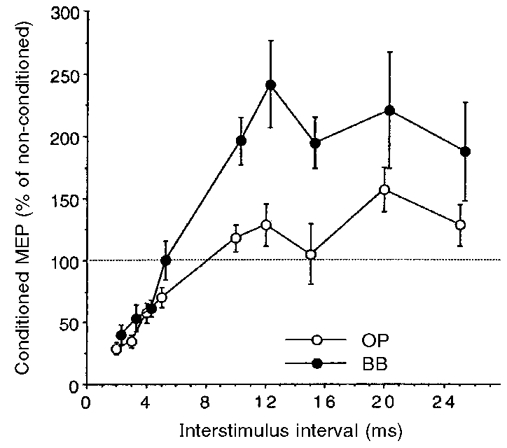
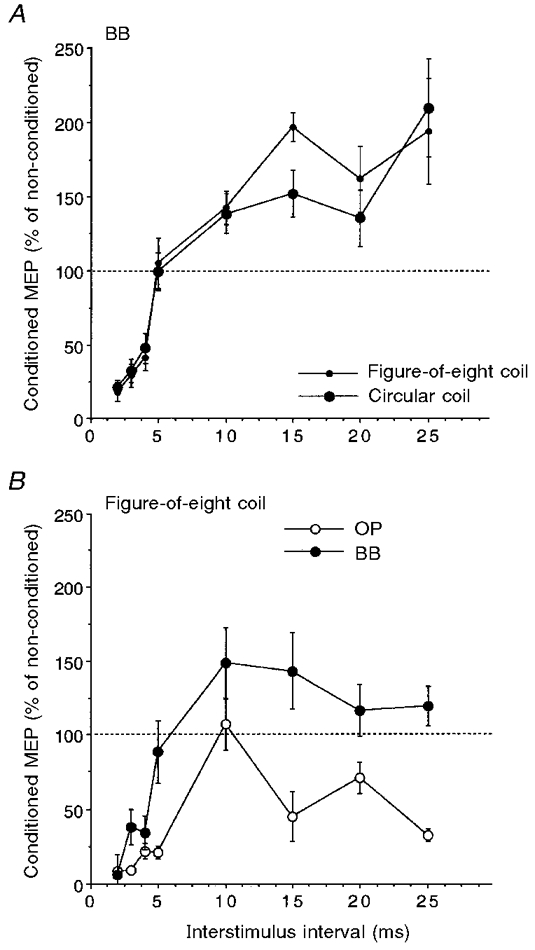
1. Cortico-cortical inhibition and facilitation induced by paired transcranial magnetic stimulation (TMS) of the human motor cortex were investigated in the distal muscle opponens pollicis (OP) and the proximal muscle biceps brachii (BB) of normal subjects. 2. The test response evoked by TMS (125 % of motor threshold, MTh) in the relaxed OP and BB muscles was inhibited by a conditioning TMS (80 % of MTh) at short interstimulus intervals (ISIs; 2-5 ms) and facilitated at longer ISIs (10-25 ms). The test response was significantly less inhibited at short ISIs and more facilitated at long ISIs in the BB than OP. 3. The MTh at rest was significantly lower for the OP than for the BB, indicating a greater excitability of OP cortical area. However, the above pattern of inhibition and facilitation was preserved both when the stimulus intensity was adjusted to evoke test responses of matched size in the two muscles and within an ample range of conditioning stimulus intensities. 4. The use of a circular coil or a focal figure-of-eight coil produced no qualitative differences in the pattern of inhibition and facilitation in either muscle. 5. The significant difference in MTh between muscles was lost during voluntary activation. In both muscles, pre-innervation abolished the cortico-cortical facilitation and reduced the cortico-cortical inhibition. However, the latter remained larger in the OP than BB muscle. 6. We suggest that the different potency of intracortical inhibitory and facilitatory circuits directed towards distal and proximal arm muscles is related to their diverse prevalent functions.


Figures

Figure 1
Figure 1. Intracortical inhibition and facilitation of distal and proximal arm muscles induced by paired transcranial magnetic cortical stimulation
Time course of paired-pulse inhibition (at ISIs of 2-5 ms) and facilitation (at ISIs of 10-25 ms) in the opponens pollicis (OP; ○) and biceps brachii (BB; •) muscles. A circular coil was used and stimulus intensity was set at 80 % of the rest motor threshold (MTh) for the conditioning stimulus and at 125 % of the MTh for the test stimulus for both muscles. Each point corresponds to the mean size (±s.e.m.) of the conditioned motor evoked potential (MEP) in 9 subjects. Changes induced by the conditioning subthreshold stimuli were significantly different in the two muscles. In the BB, inhibition at ISIs of 2-5 ms was less marked and facilitation at ISIs of 10-25 ms was more marked than in the OP. Note that the filled circles are slightly shifted to the right to avoid superimposition of error bars.
Figure 2
Figure 2. Examples of intracortical inhibition (ISI, 3 ms) and facilitation (ISI, 10 ms) in OP and BB muscles
Each trace is the average of 5 recordings from the OP and BB muscles in a single representative subject. The test MEP of the OP muscle was largely inhibited at an ISI of 3 ms and slightly facilitated at an ISI of 10 ms. Less inhibition and more facilitation was observed for the corresponding ISIs in the BB muscle. Stimulus intensities and coil as in Fig. 1.
Figure 3
Figure 3. Comparison of intracortical inhibition and facilitation induced by circular and figure-of-eight coils
A, time course of inhibition (at ISIs of 2-5 ms) and facilitation (at ISIs of 10-25 ms) induced in the BB muscle using a circular (large filled circles) and a focal figure-of-eight (small filled circles) coil. Stimulus intensities as in Fig. 1. Each point corresponds to the mean size (±s.e.m.) of the conditioned MEP in 3 subjects. Changes induced by the conditioning subthreshold stimuli were remarkably similar with either coil. B, time course of inhibition and facilitation in the OP (○) and BB (•) muscles. A focal figure-of-eight coil was used and stimulus intensity was set at 80 % of the rest MTh for the conditioning stimulus and at 125 % of the MTh for the test stimulus for both muscles. Each point corresponds to the mean size (±s.e.m.) of the conditioned MEP in 2 subjects. In BB, inhibition at ISIs of 2-5 ms was less marked and facilitation at ISIs of 10-25 ms was more marked than in the OP.
Figure 4
Figure 4. Input-output curves of OP and BB muscles upon transcranial magnetic cortical stimulation with a circular coil
The graphs show the relationships between stimulus intensity and MEP size of the OP (○) and BB (•) muscles at rest (A) and during voluntary activation (5-10 % of maximum EMG activity; B). Each point corresponds to the mean size (±s.e.m.) of the MEP in 4 subjects. A larger and steeper increase in MEP size of the OP was observed at rest, while during voluntary activation the curves were similar for both the OP and BB. Note the different range of the two ordinates.
Figure 5
Figure 5. Relationship between the degree of intracortical inhibition and facilitation and absolute MEP size in OP and BB muscles
The percentage mean inhibition (±s.e.m.) at ISIs of 2-5 ms (A) and facilitation at ISIs of 10-25 ms (B) of each subject (n = 9) are plotted against the respective absolute mean size of the test MEPs. In spite of test MEPs being of smaller size in the BB (•) than in the OP (○), conditioning stimulation seemed to induce quantitatively different inhibitory and facilitatory effects in the two muscles. The slopes of the dashed lines (best fitting the pooled data) are not significantly different from zero. Stimulus intensities and coil as in Fig. 1.
Figure 6
Figure 6. Comparison of intracortical inhibition and facilitation of size-matched MEPs of OP and BB muscles
The mean size (±s.e.m.) of test and conditioned MEPs (at ISIs of 3 and 12 ms) of the OP (formula image
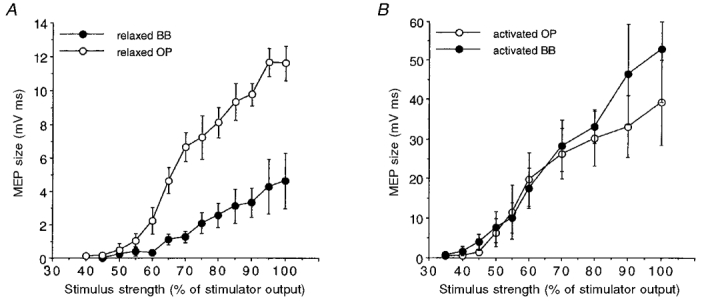
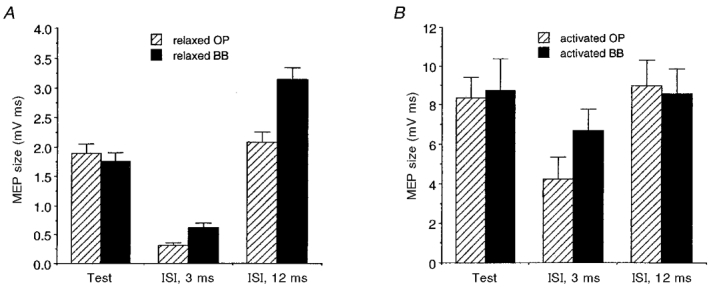
) and BB (▪) muscles is plotted both for rest and active conditions. At rest (A; n = 7), significantly less inhibition and more facilitation was observed in the BB than in the OP muscle. In both muscles, voluntary activation (B; 5-10 % of maximum EMG activity; n = 5) clearly reduced the inhibition at an ISI of 3 ms (which remained significant only in the OP muscle) and abolished the facilitation at an ISI of 12 ms. A circular coil was used with a stimulus intensity evoking test MEPs of a matched size in the two muscles, while the conditioning stimulus was always 80 % of the MTh at rest (A) or during activation (B).
Figure 7
Figure 7. Effect of varying the conditioning stimulus intensity on intracortical inhibition and facilitation of size-matched MEPs of OP and BB muscles
Intracortical inhibition (ISI, 3 ms; A) and facilitation (ISI, 12 ms; B) in the relaxed OP (○) and BB (•) muscles. A figure-of-eight coil with a stimulus intensity evoking test MEPs of a matched size in the two muscles was used. The conditioning stimulus intensity was progressively reduced in 5 % steps of the stimulator output starting from the rest threshold value. Each point corresponds to the mean value (±s.e.m.) in 6 subjects. The maximum amount of intracortical inhibition (A) was greater in the OP than in the BB, irrespective of the absolute conditioning stimulus intensity; conversely, the maximum amount of intracortical facilitation (B) was greater in the BB than in the OP muscle.
Figure 8
Figure 8. Comparison of intracortical inhibition and facilitation induced by a subthreshold conditioning stimulus in relaxed and activated OP and BB muscles
Each trace is the average of 5 recordings from the OP and BB muscles in a single subject. The intensity of the conditioning stimulus was set at 90 % of the active MTh for each muscle. Intracortical inhibition (ISI, 3 ms) was more pronounced in the OP than in the BB muscle under both relaxed (upper panel) and activated (lower panel) conditions. With this conditioning stimulus intensity no consistent intracortical facilitation (ISI, 12 ms) was observed in either muscle under both conditions.

References

    1. Abbruzzese G, Buccolieri A, Marchese R, Trompetto C, Mandich P, Schieppati M. Intracortical inhibition and facilitation are abnormal in Huntington's disease: a paired magnetic stimulation study. Neuroscience Letters. 1997;228:87–90. 10.1016/S0304-3940(97)00363-7. - DOI - PubMed
    1. Branston NM, Bentivoglio P, Momma F, Symon L. Changes in pyramidal tract conduction with experimental brain-stem ischaemia in the monkey. Electroencephalography and Clinical Neurophysiology. 1988;69:469–475. - PubMed
    1. Brown P, Ridding MC, Werhahn KJ, Rothwell JC, Marsden CD. Abnormalities of the balance between inhibition and excitation in the motor cortex of patients with cortical myoclonus. Brain. 1996;119:309–317. - PubMed
    1. Colebatch JG, Gandevia SC. The distribution of muscular weakness in upper motor neuron lesions affecting the arm. Brain. 1989;112:749–763. - PubMed
    1. Colebatch JG, Rothwell JC, Day BL, Thompson PD, Marsden CD. Cortical outflow to proximal arm muscles in man. Brain. 1990;113:1843–1856. - PubMed

LinkOut - more resources