. 1999 Jan;103(1):27-37.
doi: 10.1172/JCI4431.

A mutation in the insulin 2 gene induces diabetes with severe pancreatic beta-cell dysfunction in the Mody mouse

Affiliations

A mutation in the insulin 2 gene induces diabetes with severe pancreatic beta-cell dysfunction in the Mody mouse

J Wang et al. J Clin Invest. 1999 Jan.

Abstract

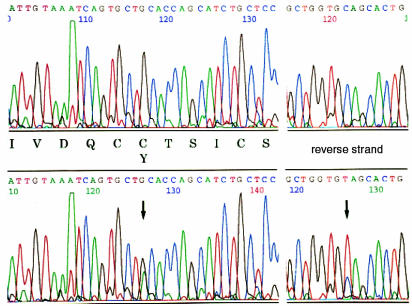
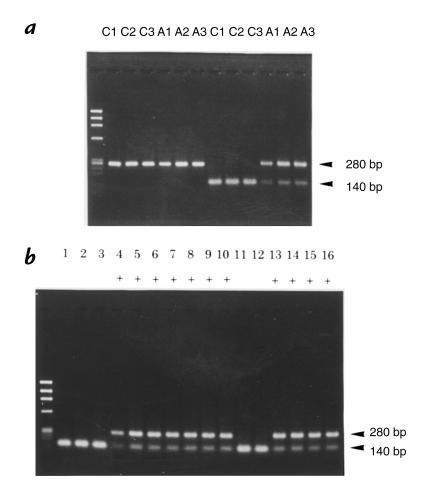
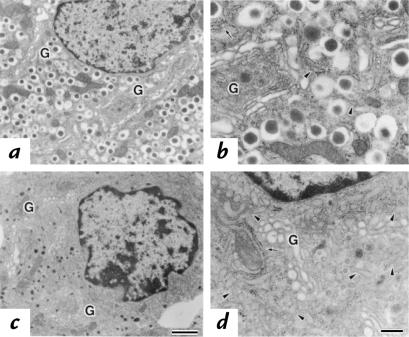
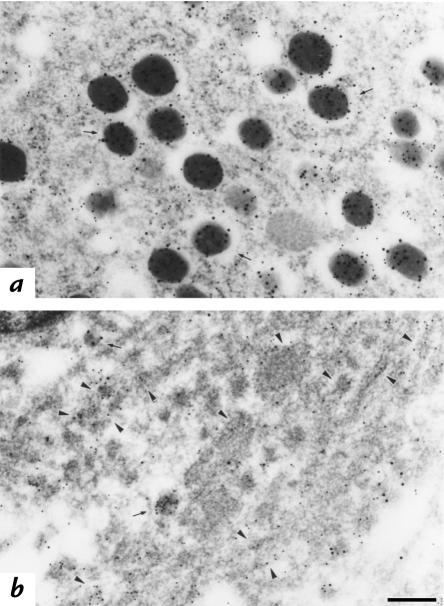
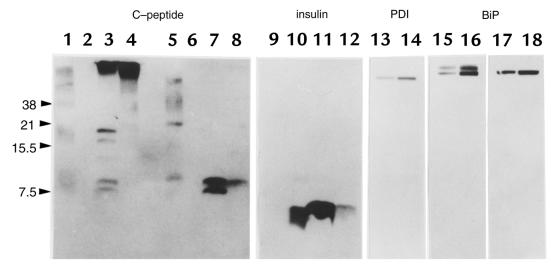
The mouse autosomal dominant mutation Mody develops hyperglycemia with notable pancreatic beta-cell dysfunction. This study demonstrates that one of the alleles of the gene for insulin 2 in Mody mice encodes a protein product that substitutes tyrosine for cysteine at the seventh amino acid of the A chain in its mature form. This mutation disrupts a disulfide bond between the A and B chains and can induce a drastic conformational change of this molecule. Although there was no gross defect in the transcription from the wild-type insulin 2 allele or two alleles of insulin 1, levels of proinsulin and insulin were profoundly diminished in the beta cells of Mody mice, suggesting that the number of wild-type (pro)insulin molecules was also decreased. Electron microscopy revealed a dramatic reduction of secretory granules and a remarkably enlarged lumen of the endoplasmic reticulum. Little proinsulin was processed to insulin, but high molecular weight forms of proinsulin existed with concomitant overexpression of BiP, a molecular chaperone in the endoplasmic reticulum. Furthermore, mutant proinsulin expressed in Chinese hamster ovary cells was inefficiently secreted, and its intracellular fraction formed complexes with BiP and was eventually degraded. These findings indicate that mutant proinsulin was trapped and accumulated in the endoplasmic reticulum, which could induce beta-cell dysfunction and account for the dominant phenotype of this mutation.


Figures

Figure 1
Figure 1
Mutation of the Ins2 gene in the Mody mouse. Ins2 exon 3 was amplified using PCR from genomic DNA. The PCR products derived from either control C57BL/6J (upper) or Mody (lower) mice were directly sequenced from both directions. A single G→A transition at nucleotide 1907 of mouse Ins2 gene (8) on one of the two alleles distinguished the Mody allele.
Figure 2
Figure 2
Genotyping of the Ins2 gene by RFLP analysis. Ins2 exon 3 was amplified using PCR from genomic DNA. The left lane shows ϕX174/Hae III-digested DNA markers. (a) The size of PCR products derived from C57BL/6J (C1, C2, and C3) or Mody mice (A1, A2, and A3) was 280 bp. The mutation found in Mody mice, described in Fig. 1, disrupts an Fnu 4HI site in the exon 3 of Ins2. Digestion with Fnu 4HI did not change the size of the PCR products from the mutated allele (280 bp) but decreased that of the wild-type allele to 140 bp. (b) Representative genotyping of 16 offspring derived from three Mody congenic lines with C3H/He background is shown. Mice with diabetes are shown as “+” under the lane number. The genotype of Ins2 was completely matched with the phenotype in each individual.
Figure 3
Figure 3
Insulin transcription in the islets. (a) Total RNA from islets was reverse transcribed to cDNA using oligo-(dT)17 primer. β-actin and insulin cDNAs were then amplified by PCR. The cycle numbers used for the PCR were 18 (lanes 1 and 2), 21 (lanes 3 and 4), 24 (lanes 5 and 6), 27 (lanes 7 and 8), and 30 (lanes 9 and 10), respectively. The amounts of cDNA from control C57BL/6J (odd lanes) and Mody mice (even lanes) were adjusted by the levels of amplified β-actin (upper panels). Note that both Ins1 and Ins2 transcripts should be amplified with equal efficiencies because primers were derived from the common sequences between them. The PCR products of Ins2 (263 bp) and Ins1 (257 bp) were not resolved in this gel system. The total insulin levels in the islets of Mody mice were approximately 85%–90% of those of the control mice (lower panels). (b) The insulin transcripts amplified from islet RNA of either C57BL/6J (lanes 1, 3, and 5) or Mody mice (lanes 2, 4, and 6) were run without digestion (lanes 1 and 2). They were then digested with Bst EII for discrimination between Ins1 (257 bp) and Ins2 (111 bp) transcripts (lanes 3 and 4). Similarly, they were digested with Fnu 4HI to separate Ins1 (167 bp), wild-typeIns2 (174 bp), and mutant Ins2 (263 bp) transcripts (lanes 5 and 6). The left lane shows radiolabeled φX174/Hinf I digested DNA markers. Because the PCR products were labeled with an end-labeled 5′ primer, the radioactivity of each band corresponds to the expression level, irrespective of its size. The measurement of the radioactivity of each band revealed that 27% and 73% of the total insulin transcripts in C57BL/6J mice are derived from Ins1 and Ins2, respectively. Similar values, 24% for Ins1 and 76% for Ins2, were obtained from Mody mice. Furthermore, 39% of the total insulin transcripts, which is approximately half the value of total Ins2, were derived from the mutant Ins2 allele in Mody mice, suggesting that both normal and mutant Ins2 alleles are transcribed similarly.
Figure 4
Figure 4
Immunofluorescent detection of insulin, C-peptide, and BiP in the islets. Pancreatic islets of C57BL/6J (a, c, and e) and Mody (b, d, and f) mice were incubated with anti-insulin (a and b), anti-C-peptide (c and d), and anti-BiP (e and f) antibodies. Note that the positive staining for insulin, C-peptide, and BiP was found exclusively in the cytoplasm, as revealed by the lissamine rhodamine sulfonyl chloride–labeling method (red). Bar, 50 μm.
Figure 5
Figure 5
Ultrastructural morphology of the islets. Electron micrographs of the β cells were taken from either C57BL/6J (a and b) or Mody (c and d) mice. Parts b and d represent higher magnification of a and c, respectively. Arrows indicate the rough ER, arrowheads represent the transitional ER, and G indicates the Golgi apparatus. Bar, 1 μm (a and c); Bar, 0.25 μm (b and d). ER, endoplasmic reticulum.
Figure 6
Figure 6
Immunolocalization of insulin and C-peptide. β cells from either C57BL/6J (a) or Mody (b) mice were double immunolabeled for insulin (large gold particles) and C-peptide (small gold particles). Although insulin and C-peptide signals are profoundly decreased in the secretory granules in Mody mice compared with the control strain (arrows), a significant amount of C-peptide immunoreactivity exists in the ER (arrowheads) in Mody mice. Bar, 0.25 μm.
Figure 7
Figure 7
Immunoblotting analysis of the islet proteins. An equal amount of the islet protein (50 μg) from either C57BL/6J (lanes 3 and 7) or Mody mice (lanes 4 and 8) was loaded in each lane onto 16.5% polyacrylamide gel with (lanes 58) or without (lanes 14) 100 mM DTT. Human proinsulin (lanes 1 and 5) and human insulin (lanes 2 and 6) were loaded as standards. The human C-peptide ran off this tricine–SDS-PAGE system (data not shown). Immunoblotting was performed using anti–C-peptide antibodies (lanes 18). On the same membranes, similar analyses were performed using anti-insulin (lanes 912, corresponding to lanes 14 in the C-peptide immunoblot), anti-PDI (lanes 13 and 14, corresponding to lanes 3 and 4), and anti-BiP antibodies (lanes 1518, corresponding to lanes 3, 4, 7, and 8). The islet protein lysed by either sample buffer containing 3% SDS (16) or acid-ethanol (26) revealed similar proteins immunoreactive to anti–C-peptide antibodies on nonreducing gels (data not shown). DTT, dithiothreitol; PDI, protein disulfide isomerase.
Figure 8
Figure 8
CHO cell lines expressing either wild-type or mutant insulin 2. (a) Northern blot analysis of insulin. Total RNA (20 μg) from CHO (lane 1), CHO-Ins2wt (clone w9; lane 2), and CHO-Ins2Mody cells (clone a7; lane 3) were electrophoresed, transferred to a nylon membrane, and hybridized with a mouse Ins2 cDNA probe. (b) Insulin secretion of CHO-Ins2wt (clone w9) and CHO-Ins2Mody (clone a7). Both cells were seeded at a density of 2 × 10⁵ cells/6-cm dish. After 24 h, the cells were incubated with serum-free media for the indicated times. Insulin stored in the cells (black bars) and that released into the media (open bars) were measured using anti-insulin antibodies. Although cell density and time course were different, similar data were obtained from another independent experiment. (c) Proinsulin content and secretion. CHO-Ins2wt (lanes 3 and 8 for clone w7; lanes 4 and 9 for clone w9), and CHO-Ins2Mody cells (lanes 5 and 10 for clone a1; lanes 6 and 11 for clone a3; lanes 7 and 12 for clone a7) were incubated with serum-free media for 24 h. The cells (lanes 37) were then solubilized, and the media (lanes 812) were concentrated by 10% trichloroacetic acid. These samples were resolved with tricine–SDS-PAGE (16.5% polyacrylamide gel) in a reducing condition (100 mM DTT). Immunoblotting analysis was performed using anti–C-peptide antibodies. Lanes 1 and 2 contain human proinsulin standard and the islet protein from normal C57BL/6J mice, respectively. CHO, Chinese hamster ovary.
Figure 9
Figure 9
Pulse-chase labeling of CHO cells that express wild-type and mutant insulin. CHO-Ins2wt (clone w9, upper) and CHO-Ins2Mody (clone a7, lower) were labeled for 30 min with [35S]methionine. After chasing for indicated times, immunoprecipitation was performed from either cell extracts (C) or media (M), using a mixture of anti-insulin and anti–C-peptide antibodies. Immune complexes were analyzed with tricine–SDS-PAGE (16.5% polyacrylamide gel).
Figure 10
Figure 10
Coprecipitation of proinsulin and BiP. Proinsulin was immunoprecipitated from CHO (lane 1), CHO-Ins2wt (clone w9; lane 2), and CHO-Ins2Mody cells (clone a7, lane 3). Immunoprecipitates were loaded on glycine–SDS-PAGE gel (8% polyacrylamide gel), transferred onto an Immobilon-P membrane, and immunoblotted with anti-BiP antibodies. The faint band of BiP immunoprecipitated from CHO cells (lane 1) might be due to its weak affinity to immunoglobulin.

References

    1. King H, Rewers M. WHO Ad Hoc Diabetes Reporting Group. Global estimates for prevalence of diabetes mellitus and impaired glucose tolerance in adults. Diabetes Care. 1993;16:157–177. - PubMed
    1. Fajans SS. Scope and heterogeneous nature of MODY. Diabetes Care. 1990;13:49–64. - PubMed
    1. Froguel P, Vaxillaire M, Velho G. Genetic and metabolic heterogeneity of maturity-onset diabetes of the young. Diabetes Rev. 1997;5:123–130.
    1. Leiter EH, Herberg L. The polygenetics of diabesity in mice. Diabetes Rev. 1997;5:131–148.
    1. Yoshioka M, Kayo T, Ikeda T, Koizumi A. A novel locus, Mody4, distal to D7Mit189 on chromosome 7 determines early-onset NIDDM in nonobese C57BL/6 (Akita) mutant mice. Diabetes. 1997;46:887–894. - PubMed

Publication types

MeSH terms