

High-throughput real-time reverse transcription-PCR quantitation of hepatitis C virus RNA
- PMID: 9889212
- PMCID: PMC84298
- DOI: 10.1128/JCM.37.2.327-332.1999
High-throughput real-time reverse transcription-PCR quantitation of hepatitis C virus RNA
Abstract
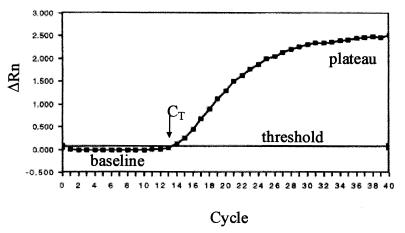
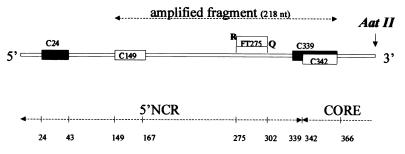
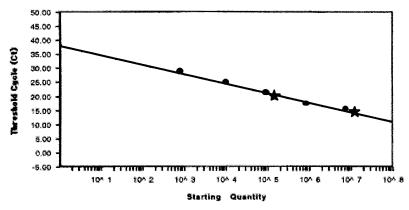
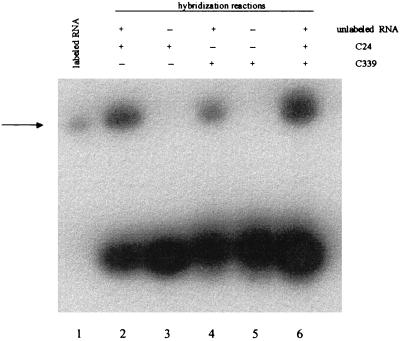
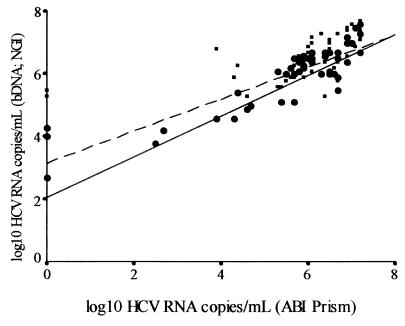
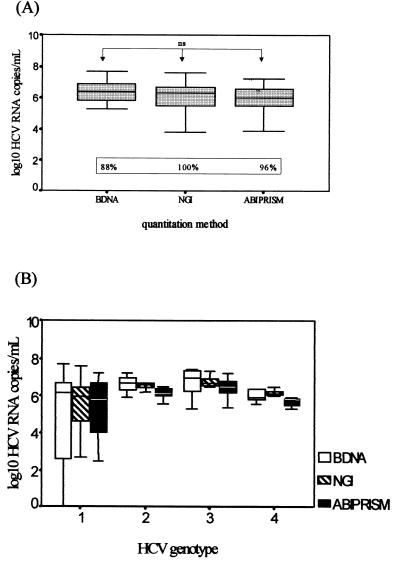
We describe a rapid and reproducible method for assessment of the hepatitis C virus (HCV) load in serum samples. The method combines Taqman technology (Roche) and the ABI Prism 7700 (Perkin Elmer) real-time sequence detection system. We have optimized a single-tube reverse transcription-PCR (RT-PCR) that contains a dual-labeled fluorogenic probe to quantify the 5' noncoding region (5' NCR) of HCV. The probe contains a fluorescent reporter at the 5' end and a fluorescent quencher at the 3' end. The use of such a probe combined with the 5'-3' nuclease activity of Taq polymerase allows direct quantitation of the PCR product by the detection of a fluorescent reporter released in the course of the exponential phase of the PCR. For accurate quantitation of the number of copies of HCV in samples containing unknown quantities, we have used serial dilutions of a synthetic 5' NCR RNA standard of HCV that was previously quantified with an isotopic tracer. The method has a 5-log dynamic range (10(3) to 10(7)). The coefficient of regression of the standard curve was, on average, 0.98. The intra-assay and the interassay coefficients of variation of the threshold cycle were 1% and 6.2%, respectively. Seventy-nine RNA samples from the sera of infected patients were quantified by this method. Comparison of the results with those obtained by other quantitation methods (the Quantiplex 2.0 branched-DNA assay and the Superquant assay from the National Genetics Institute) revealed a significant correlation with all of the results. The mean values were also statistically comparable. In conclusion, the high sensitivity, simplicity, and reproducibility of the real-time HCV RNA quantitation which allows the screening of large numbers of samples, combined with its wide dynamic range, make this method especially suitable for monitoring of the viral load during therapy and tailoring of treatment schedules.
Figures
Similar articles
-
TaqMan amplification system with an internal positive control for HCV RNA quantitation.J Clin Virol. 2004 Nov;31(3):227-34. doi: 10.1016/j.jcv.2004.03.009. J Clin Virol. 2004. PMID: 15465417
-
Development of a low-cost real-time reverse transcriptase-polymerase chain reaction technique for the detection and quantification of hepatitis C viral load.Clin Chem Lab Med. 2010 Jun;48(6):777-84. doi: 10.1515/CCLM.2010.134. Clin Chem Lab Med. 2010. PMID: 20218905
-
Real-time RT-PCR for quantitation of hepatitis C virus RNA.J Virol Methods. 2002 Apr;102(1-2):119-28. doi: 10.1016/s0166-0934(02)00007-1. J Virol Methods. 2002. PMID: 11879700
-
Comparison of a competitive combined reverse transcription-PCR assay with a branched-DNA assay for hepatitis C virus RNA quantitation.J Clin Microbiol. 1996 Nov;34(11):2702-6. doi: 10.1128/jcm.34.11.2702-2706.1996. J Clin Microbiol. 1996. PMID: 8897168 Free PMC article.
-
Development and evaluation of a quantitative competitive reverse transcription polymerase chain reaction (RT-PCR) for hepatitis C virus RNA in serum using transcribed thio-RNA as internal control.J Virol Methods. 2004 Mar 1;116(1):45-54. doi: 10.1016/j.jviromet.2003.10.009. J Virol Methods. 2004. PMID: 14715306
Cited by
-
Dynamic range of hepatitis C virus RNA quantification with the Cobas Ampliprep-Cobas Amplicor HCV Monitor v2.0 assay.J Clin Microbiol. 2005 Apr;43(4):1669-73. doi: 10.1128/JCM.43.4.1669-1673.2005. J Clin Microbiol. 2005. PMID: 15814982 Free PMC article. Clinical Trial.
-
Rapid detection and quantification of members of the archaeal community by quantitative PCR using fluorogenic probes.Appl Environ Microbiol. 2000 Nov;66(11):5066-72. doi: 10.1128/AEM.66.11.5066-5072.2000. Appl Environ Microbiol. 2000. PMID: 11055964 Free PMC article.
-
Use of the MagNA pure LC automated nucleic acid extraction system followed by real-time reverse transcription-PCR for ultrasensitive quantitation of hepatitis C virus RNA.J Clin Microbiol. 2004 Sep;42(9):4130-6. doi: 10.1128/JCM.42.9.4130-4136.2004. J Clin Microbiol. 2004. PMID: 15365000 Free PMC article.
-
Sensitive and specific detection of strains of Japanese encephalitis virus using a one-step TaqMan RT-PCR technique.J Med Virol. 2004 Dec;74(4):589-96. doi: 10.1002/jmv.20218. J Med Virol. 2004. PMID: 15484282 Free PMC article.
-
Pseudomonas stutzeri nitrite reductase gene abundance in environmental samples measured by real-time PCR.Appl Environ Microbiol. 2001 Feb;67(2):760-8. doi: 10.1128/AEM.67.2.760-768.2001. Appl Environ Microbiol. 2001. PMID: 11157241 Free PMC article.
References
-
- Alter H J, Sanchez-Pescador R, Urdea M S, Wilber J C, Lagier R J, Di Bisceglie A M, Shih J W, Neuwald P D. Evaluation of branched DNA signal amplification for the detection of hepatitis C virus RNA. J Viral Hepat. 1995;2:121–132. - PubMed
-
- Benvegnu L, Pontisso P, Cavalletto D, Noventa F, Chemello L, Alberti A. Lack of correlation between hepatitis C virus genotypes and clinical course of hepatitis C virus-related cirrhosis. Hepatology. 1997;25:211–215. - PubMed
-
- Branch A D, Benenfeld B J, Baroudy B M, Wells F V, Guerin J L, Robertson H D. An untraviolet-sensitive RNA structural element in viroid-like domain of hepatitis delta virus. Science. 1989;243:649–652. - PubMed
Publication types
MeSH terms
Substances
LinkOut - more resources
Full Text Sources
Other Literature Sources
Medical
