. 1999 Jan 18;189(2):289-300.
doi: 10.1084/jem.189.2.289.

Positive and negative regulation of V(D)J recombination by the E2A proteins

Affiliations

Positive and negative regulation of V(D)J recombination by the E2A proteins

G Bain et al. J Exp Med. .

Abstract

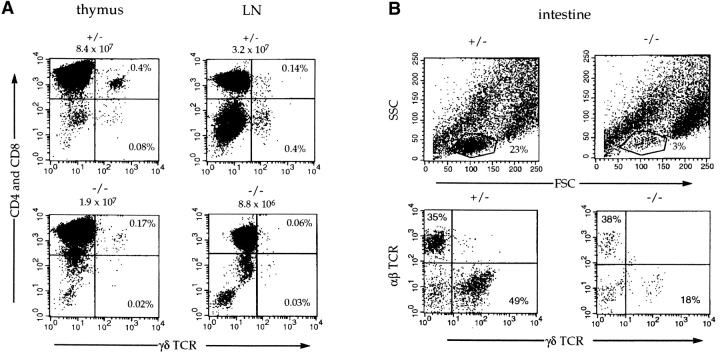
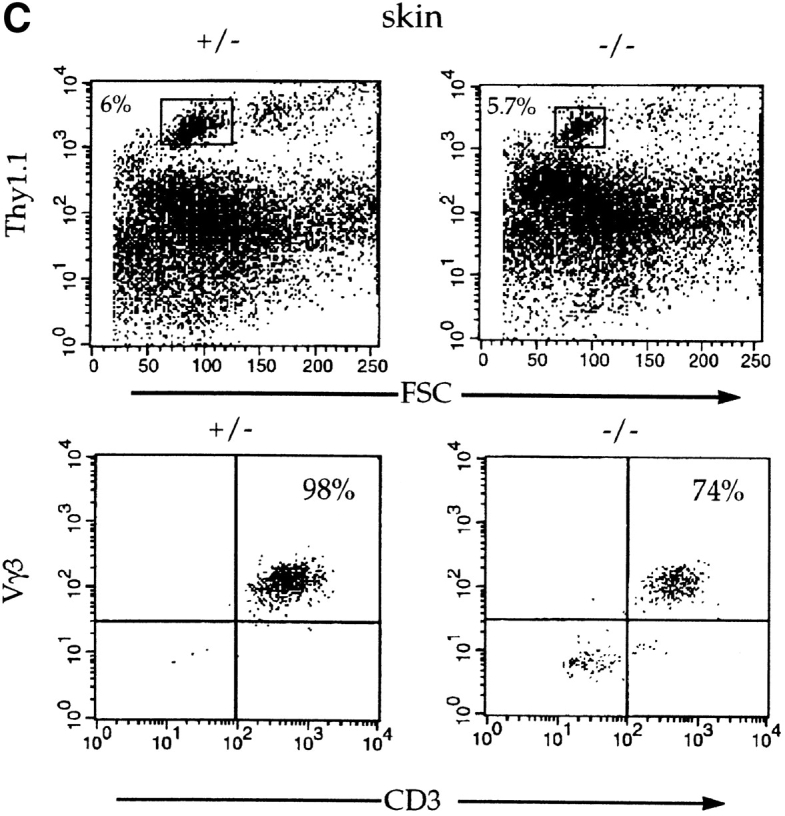
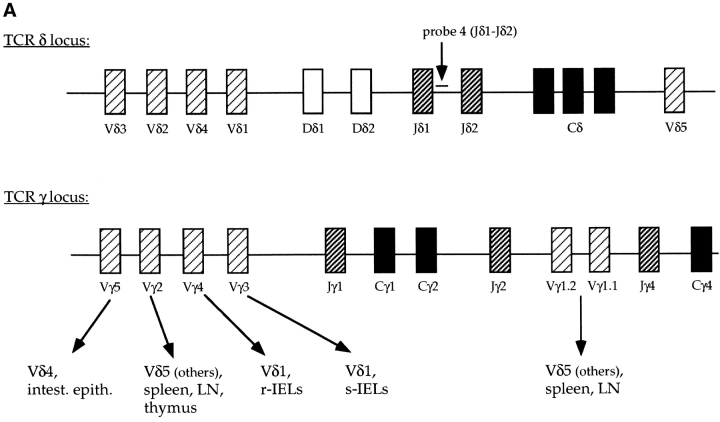
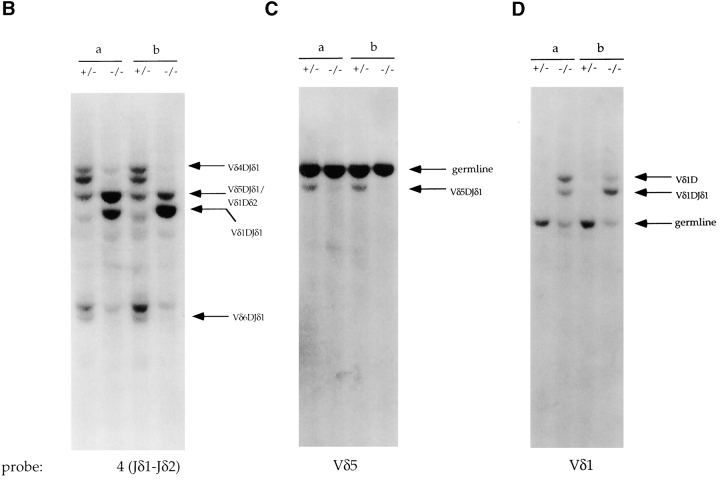
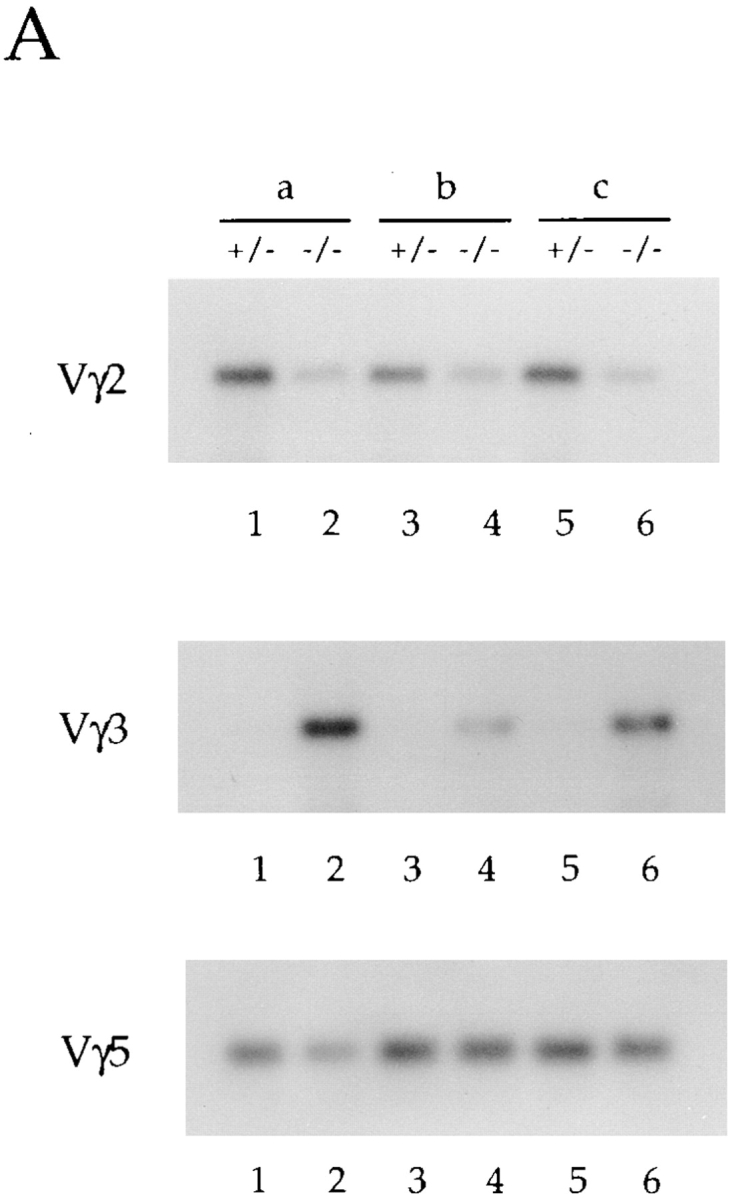
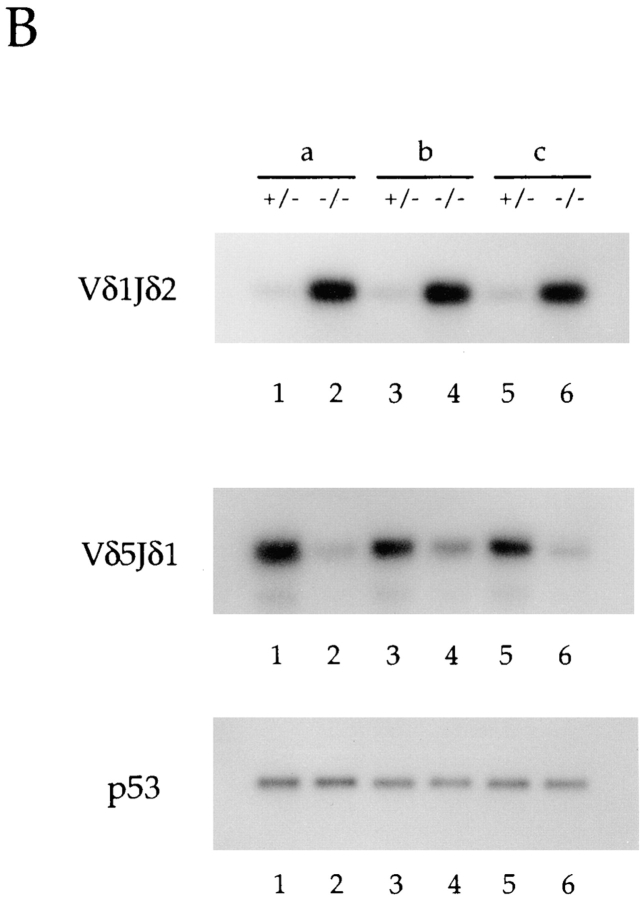
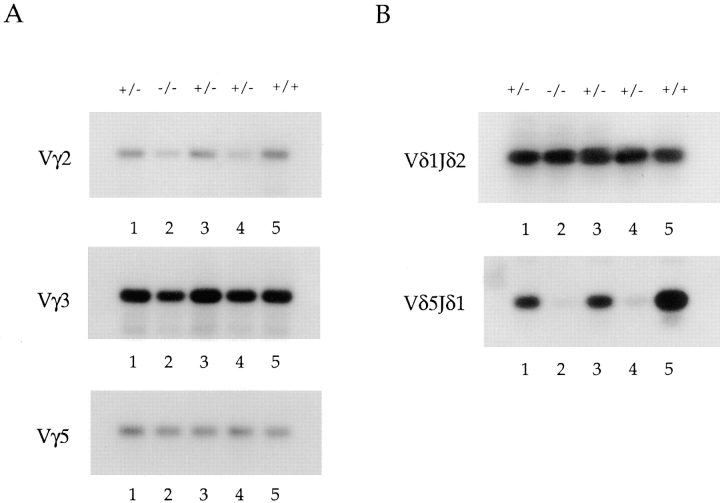
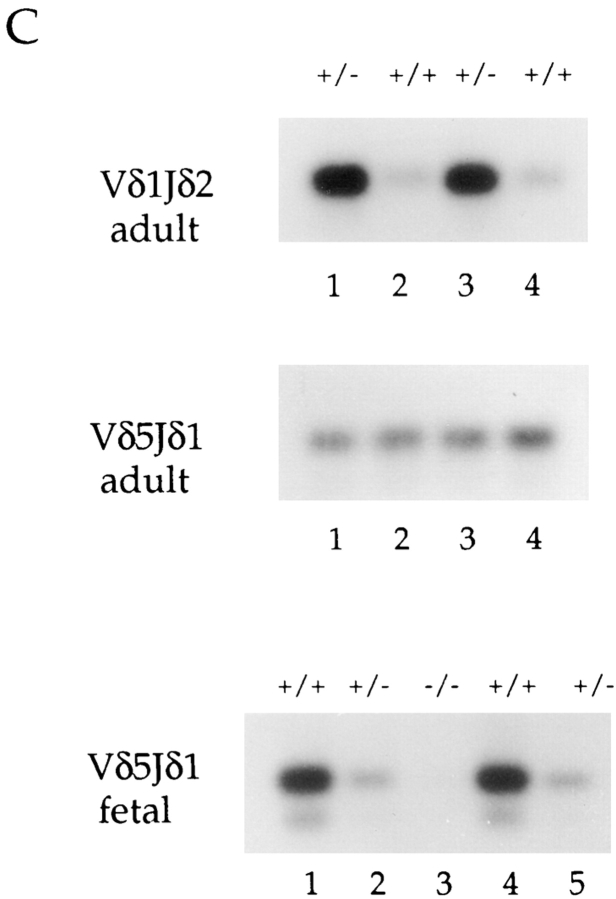
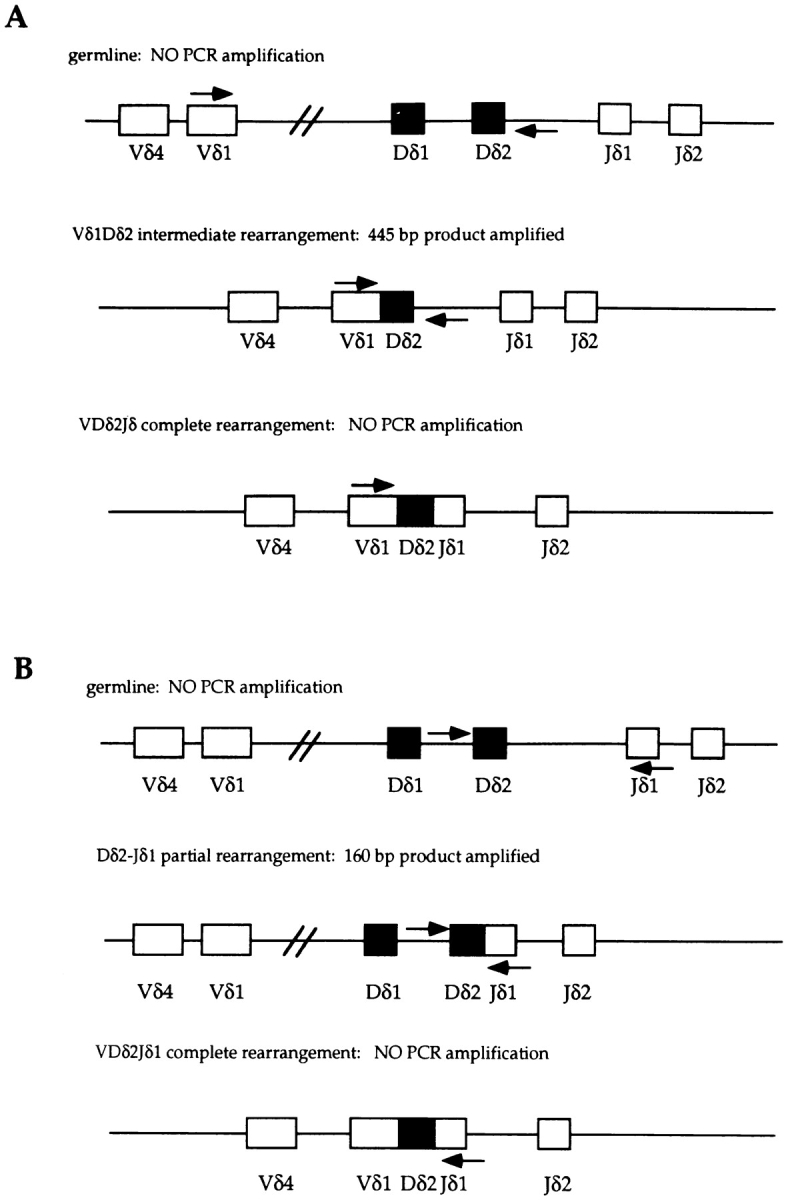
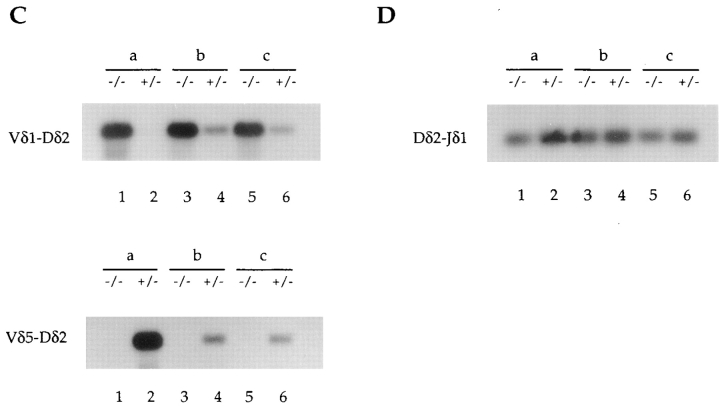
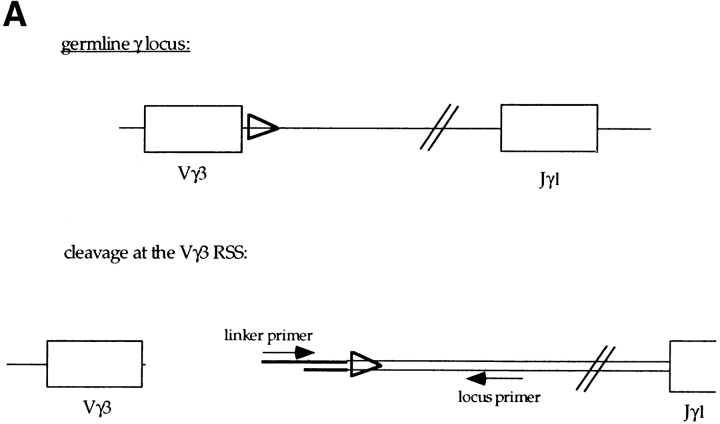
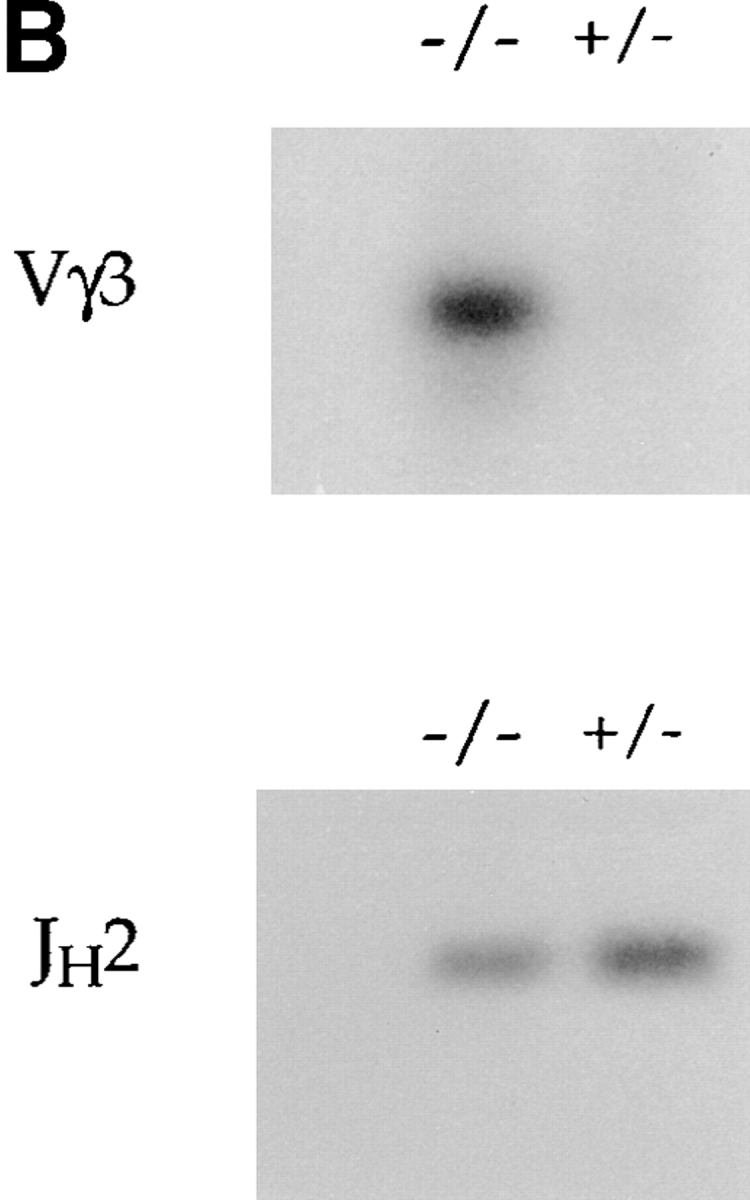
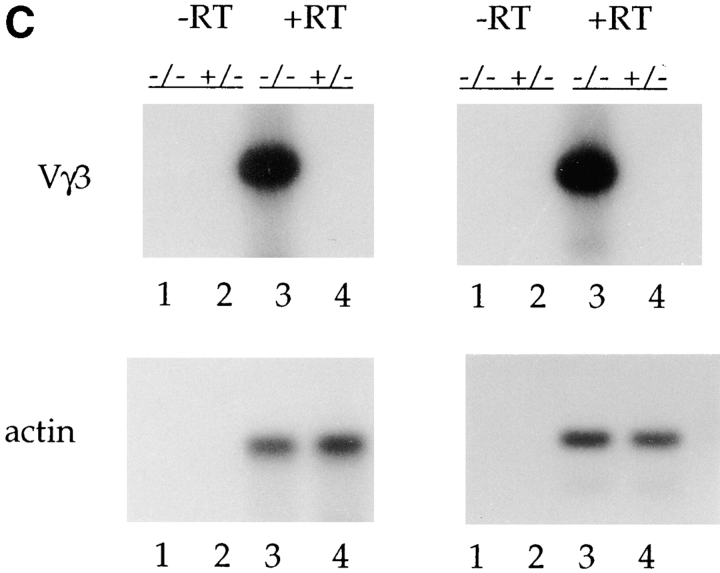
A key feature of B and T lymphocyte development is the generation of antigen receptors through the rearrangement and assembly of the germline variable (V), diversity (D), and joining (J) gene segments. However, the mechanisms responsible for regulating developmentally ordered gene rearrangements are largely unknown. Here we show that the E2A gene products are essential for the proper coordinated temporal regulation of V(D)J rearrangements within the T cell receptor (TCR) gamma and delta loci. Specifically, we show that E2A is required during adult thymocyte development to inhibit rearrangements to the gamma and delta V regions that normally recombine almost exclusively during fetal thymocyte development. The continued rearrangement of the fetal Vgamma3 gene segment in E2A-deficient adult thymocytes correlates with increased levels of Vgamma3 germline transcripts and increased levels of double-stranded DNA breaks at the recombination signal sequence bordering Vgamma3. Additionally, rearrangements to a number of Vgamma and Vdelta gene segments used predominantly during adult development are significantly reduced in E2A-deficient thymocytes. Interestingly, at distinct stages of T lineage development, both the increased and decreased rearrangement of particular Vdelta gene segments is highly sensitive to the dosage of the E2A gene products, suggesting that the concentration of the E2A proteins is rate limiting for the recombination reaction involving these Vdelta regions.


Figures

Figure 1
Figure 1
Flow cytometric analysis of γ/δ T cell populations in E2A-deficient mice. Flow cytometric analysis of thymus and lymph node (LN) cells from a 6-wk-old E2A-deficient mouse and a heterozygous littermate (A). Cells were stained with anti-CD4PE, anti-CD8PE, and anti–γ/δ TCRFITC. The number shown above each FACS® profile represents the total number of cells isolated from that tissue. The percentages of γ/δ cells are indicated. The total number of γ/δ cells is decreased 10–20-fold in the thymus and lymph nodes of E2A-deficient mice. (B) Intestinal T cells from an E2A-deficient mouse and a heterozygous littermate were stained with anti–α/β TCRcy-chrome and anti–γ/δ TCRbiotin (streptavidin-PE). The total number of intestinal lymphocytes (top) is decreased approximately sevenfold in the E2A-deficient mice (3 vs. 23%). Bottom panels show the α/β versus γ/δ staining of the lymphocytes gated in the top panels with the percentages of each population indicated. (C) Cells isolated from the skin of an E2A-deficient mouse and a heterozygous littermate were stained with anti-Thy1.1biotin (streptavidin–Red 670), anti-CD3PE, and anti-Vγ3FITC. T cells were gated on the basis of forward scatter and Thy1.1 expression (top), and the gated cells were analyzed for the expression of CD3 and Vγ3 (bottom).
Figure 1
Figure 1
Flow cytometric analysis of γ/δ T cell populations in E2A-deficient mice. Flow cytometric analysis of thymus and lymph node (LN) cells from a 6-wk-old E2A-deficient mouse and a heterozygous littermate (A). Cells were stained with anti-CD4PE, anti-CD8PE, and anti–γ/δ TCRFITC. The number shown above each FACS® profile represents the total number of cells isolated from that tissue. The percentages of γ/δ cells are indicated. The total number of γ/δ cells is decreased 10–20-fold in the thymus and lymph nodes of E2A-deficient mice. (B) Intestinal T cells from an E2A-deficient mouse and a heterozygous littermate were stained with anti–α/β TCRcy-chrome and anti–γ/δ TCRbiotin (streptavidin-PE). The total number of intestinal lymphocytes (top) is decreased approximately sevenfold in the E2A-deficient mice (3 vs. 23%). Bottom panels show the α/β versus γ/δ staining of the lymphocytes gated in the top panels with the percentages of each population indicated. (C) Cells isolated from the skin of an E2A-deficient mouse and a heterozygous littermate were stained with anti-Thy1.1biotin (streptavidin–Red 670), anti-CD3PE, and anti-Vγ3FITC. T cells were gated on the basis of forward scatter and Thy1.1 expression (top), and the gated cells were analyzed for the expression of CD3 and Vγ3 (bottom).
Figure 2
Figure 2
E2A-deficient mice display an altered pattern of Vδ gene rearrangements. (A) Schematic diagram of the TCR δ and γ loci showing the relative location of the V, D, and J gene segments. The arrows in the γ locus indicate the Vδ region that normally pairs with that Vγ and the site to which the cells expressing that specific TCR home. s-IEL and r-IEL, skin intraepithelial lymphocytes and reproductive tract intraepithelial lymphocytes, respectively. (B–D) Southern blot analysis of EcoRI- digested total thymus DNA from two E2A-deficient mice and their heterozygous littermates to determine the types of Vδ rearrangements detectable. (B) The blot hybridized with probe 4 which is located between Jδ1 and Jδ2 (A, δ locus). The band marked by the bent arrow is detectable only in the E2A-deficient DNA samples. The probe 4(Jδ1-Jδ2) blot was stripped and rehybridized sequentially with a Vδ5-specific (C) or Vδ1-specific (D) probe. Vδ5DJδ1 rearrangements are present in the control DNA samples (C, arrow). The Vδ5 germline fragment is also indicated. Wild-type DNAs show only the germline band when hybridized with a Vδ1 probe (D), but two rearrangements are detectable in the E2A-deficient DNAs. Based on the size of the two rearranged bands (∼8.8 and 9.5 kb) and the fact that they also hybridize with probe 4, they likely represent Vδ1D intermediate rearrangements and Vδ1DJδ1 rearrangements.
Figure 2
Figure 2
E2A-deficient mice display an altered pattern of Vδ gene rearrangements. (A) Schematic diagram of the TCR δ and γ loci showing the relative location of the V, D, and J gene segments. The arrows in the γ locus indicate the Vδ region that normally pairs with that Vγ and the site to which the cells expressing that specific TCR home. s-IEL and r-IEL, skin intraepithelial lymphocytes and reproductive tract intraepithelial lymphocytes, respectively. (B–D) Southern blot analysis of EcoRI- digested total thymus DNA from two E2A-deficient mice and their heterozygous littermates to determine the types of Vδ rearrangements detectable. (B) The blot hybridized with probe 4 which is located between Jδ1 and Jδ2 (A, δ locus). The band marked by the bent arrow is detectable only in the E2A-deficient DNA samples. The probe 4(Jδ1-Jδ2) blot was stripped and rehybridized sequentially with a Vδ5-specific (C) or Vδ1-specific (D) probe. Vδ5DJδ1 rearrangements are present in the control DNA samples (C, arrow). The Vδ5 germline fragment is also indicated. Wild-type DNAs show only the germline band when hybridized with a Vδ1 probe (D), but two rearrangements are detectable in the E2A-deficient DNAs. Based on the size of the two rearranged bands (∼8.8 and 9.5 kb) and the fact that they also hybridize with probe 4, they likely represent Vδ1D intermediate rearrangements and Vδ1DJδ1 rearrangements.
Figure 3
Figure 3
Differential usage of the Vγ and Vδ gene segments in E2A-deficient mice. (A and B) PCR analysis of total thymus DNA from adult (6-wk-old) E2A-deficient mice and their heterozygous littermates to determine the relative level of Vγ (A) and Vδ (B) gene rearrangements. Forward primers were specific for each V region. The Jγ1 reverse primer used recognizes all Jγ gene segments, whereas the reverse Jδ primers are specific for either Jδ1 or Jδ2. The δ PCRs were performed with both reverse primers, and the results were identical. A control reaction was performed with p53 primers. Shown are three independent knockouts (designated a, b, and c) and their heterozygous littermates.
Figure 3
Figure 3
Differential usage of the Vγ and Vδ gene segments in E2A-deficient mice. (A and B) PCR analysis of total thymus DNA from adult (6-wk-old) E2A-deficient mice and their heterozygous littermates to determine the relative level of Vγ (A) and Vδ (B) gene rearrangements. Forward primers were specific for each V region. The Jγ1 reverse primer used recognizes all Jγ gene segments, whereas the reverse Jδ primers are specific for either Jδ1 or Jδ2. The δ PCRs were performed with both reverse primers, and the results were identical. A control reaction was performed with p53 primers. Shown are three independent knockouts (designated a, b, and c) and their heterozygous littermates.
Figure 4
Figure 4
PCR analysis of V gene rearrangements in E2A-deficient fetal thymus DNAs. Vγ (A) and Vδ (B) gene rearrangements from E19 fetal thymus DNAs. All fetal thymus DNA samples shown are from the same litter. (C) PCR analysis of Vδ5 and Vδ1 gene rearrangements from two independent adult (6-wk-old) E2A heterozygous mice and their wild-type littermates. Vδ5 rearrangements from five E19 fetal thymocyte DNAs are shown for comparison. The number of PCR cycles used for the adult Vδ1 rearrangements in C was increased (compared with Fig. 3 B) in order to enhance the signal from the heterozygotes.
Figure 4
Figure 4
PCR analysis of V gene rearrangements in E2A-deficient fetal thymus DNAs. Vγ (A) and Vδ (B) gene rearrangements from E19 fetal thymus DNAs. All fetal thymus DNA samples shown are from the same litter. (C) PCR analysis of Vδ5 and Vδ1 gene rearrangements from two independent adult (6-wk-old) E2A heterozygous mice and their wild-type littermates. Vδ5 rearrangements from five E19 fetal thymocyte DNAs are shown for comparison. The number of PCR cycles used for the adult Vδ1 rearrangements in C was increased (compared with Fig. 3 B) in order to enhance the signal from the heterozygotes.
Figure 5
Figure 5
Detection of δ gene intermediate rearrangement products in E2A-deficient mice and their heterozygous littermates. (A) Schematic diagram of the δ locus showing the relative location of the forward and reverse primers used to detect V-D intermediate rearrangement products. A fully rearranged V-D-J allele results in the deletion of the reverse primer, which is located 3′ of Dδ2. As a result, only the intermediate V-D rearrangements can be PCR amplified. (B) Diagram showing the location of the PCR primers used in the detection of D-J intermediates. Rearrangement of any V region to Dδ2 results in the deletion of the forward PCR primer. Thus, only D-J intermediates can be PCR amplified. (C) Vδ1-Dδ2, Vδ5-Dδ2, and Dδ2-Jδ1 PCR analysis of total thymus DNA from three independent 6-wk-old E2A-deficient mice (designated a, b, and c) and their heterozygous littermates.
Figure 5
Figure 5
Detection of δ gene intermediate rearrangement products in E2A-deficient mice and their heterozygous littermates. (A) Schematic diagram of the δ locus showing the relative location of the forward and reverse primers used to detect V-D intermediate rearrangement products. A fully rearranged V-D-J allele results in the deletion of the reverse primer, which is located 3′ of Dδ2. As a result, only the intermediate V-D rearrangements can be PCR amplified. (B) Diagram showing the location of the PCR primers used in the detection of D-J intermediates. Rearrangement of any V region to Dδ2 results in the deletion of the forward PCR primer. Thus, only D-J intermediates can be PCR amplified. (C) Vδ1-Dδ2, Vδ5-Dδ2, and Dδ2-Jδ1 PCR analysis of total thymus DNA from three independent 6-wk-old E2A-deficient mice (designated a, b, and c) and their heterozygous littermates.
Figure 6
Figure 6
Analysis of the level of double-stranded DNA breaks at the Vγ3 and JH2 RSS and the level of Vγ3 germline transcripts in E2A-deficient mice. (A) Schematic diagram of the linker-ligation assay for detecting broken ends at the Vγ3 RSS. The thick line represents the ligated BW-1/BW-2 linker. (B) Total thymus DNA from an E2A-deficient mouse and a heterozygous littermate was analyzed for broken ends at the RSS 3′ of Vγ3 and 5′ of JH2 using LM-PCR. The same linker-ligated DNA was used for each of the PCR reactions. (C) Total thymocyte RNA from adult E2A-deficient mice and heterozygous littermates was analyzed by RT-PCR for the presence of Vγ3 sterile transcripts. Positive control RT-PCR reactions were performed with β-actin primers.
Figure 6
Figure 6
Analysis of the level of double-stranded DNA breaks at the Vγ3 and JH2 RSS and the level of Vγ3 germline transcripts in E2A-deficient mice. (A) Schematic diagram of the linker-ligation assay for detecting broken ends at the Vγ3 RSS. The thick line represents the ligated BW-1/BW-2 linker. (B) Total thymus DNA from an E2A-deficient mouse and a heterozygous littermate was analyzed for broken ends at the RSS 3′ of Vγ3 and 5′ of JH2 using LM-PCR. The same linker-ligated DNA was used for each of the PCR reactions. (C) Total thymocyte RNA from adult E2A-deficient mice and heterozygous littermates was analyzed by RT-PCR for the presence of Vγ3 sterile transcripts. Positive control RT-PCR reactions were performed with β-actin primers.

Similar articles

Cited by

References

    1. Tonegawa S. Somatic generation of antibody diversity. Nature. 1983;302:575–581. - PubMed
    1. Schatz D, Oettinger M, Schlissel M. V(D)J recombination: molecular biology and regulation. Annu Rev Immunol. 1992;10:359–383. - PubMed
    1. Oettinger M, Schatz D, Gorka C, Baltimore D. RAG-1 and RAG-2, adjacent genes that synergistically activate V(D)J recombination. Science. 1990;248:1517–1523. - PubMed
    1. McBlane J, van Gent D, Ramsden D, Romeo C, Cuomo C, Gellert M, Oettinger M. Cleavage at a V(D)J recombination signal requires only RAG1 and RAG2 proteins and occurs in two steps. Cell. 1995;83:387–395. - PubMed
    1. Mombaerts P, Iacomini J, Johnson RS, Herrup K, Tonegawa S, Papaioannou VE. RAG-1-deficient mice have no mature B and T lymphocytes. Cell. 1992;68:869–877. - PubMed

Publication types

MeSH terms

Substances