. 1999 Jan 18;189(2):309-18.
doi: 10.1084/jem.189.2.309.

Biochemical nature and cellular distribution of the paired immunoglobulin-like receptors, PIR-A and PIR-B

Affiliations

Biochemical nature and cellular distribution of the paired immunoglobulin-like receptors, PIR-A and PIR-B

H Kubagawa et al. J Exp Med. .

Abstract

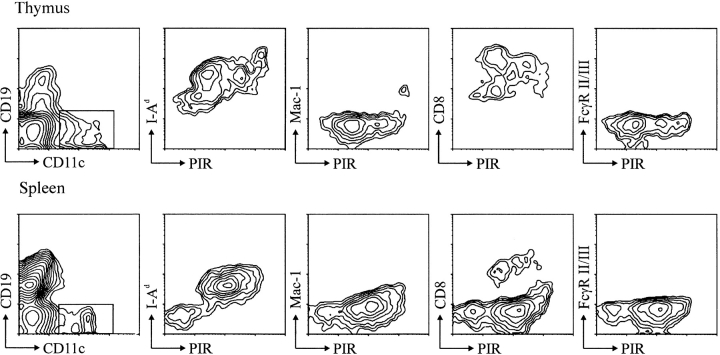
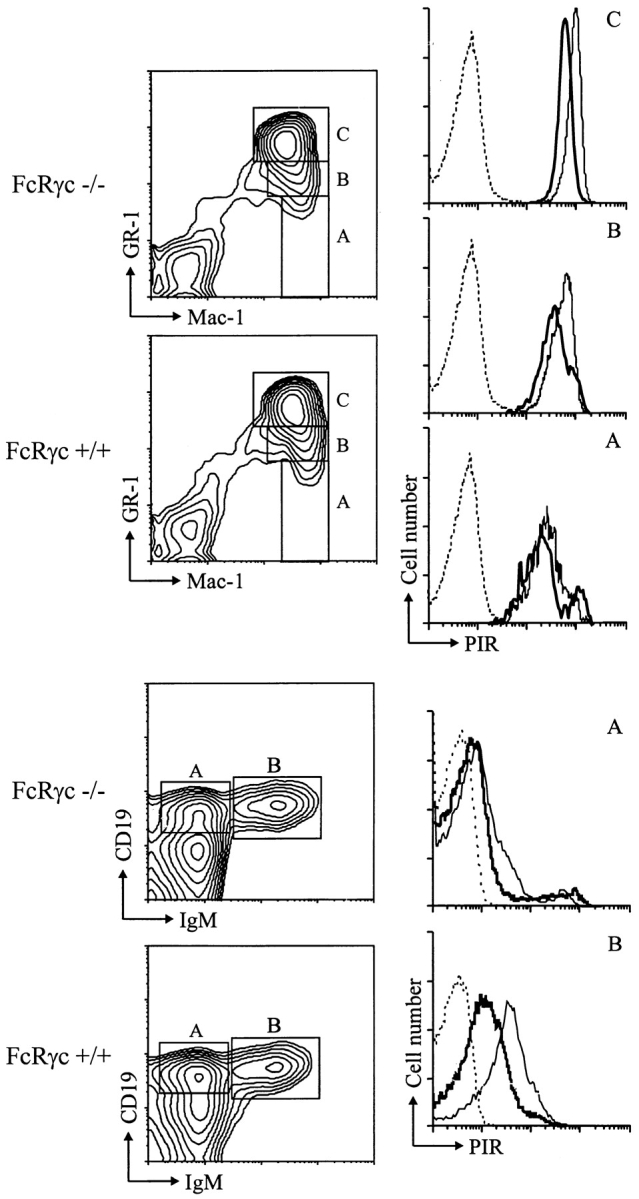
PIR-A and PIR-B, paired immunoglobulin-like receptors encoded, respectively, by multiple Pira genes and a single Pirb gene in mice, are relatives of the human natural killer (NK) and Fc receptors. Monoclonal and polyclonal antibodies produced against a recombinant PIR protein identified cell surface glycoproteins of approximately 85 and approximately 120 kD on B cells, granulocytes, and macrophages. A disulfide-linked homodimer associated with the cell surface PIR molecules was identified as the Fc receptor common gamma (FcRgammac) chain. Whereas PIR-B fibroblast transfectants expressed cell surface molecules of approximately 120 kD, PIR-A transfectants expressed the approximately 85-kD molecules exclusively intracellularly; PIR-A and FcRgammac cotransfectants expressed the PIR-A/ FcRgammac complex on their cell surface. Correspondingly, PIR-B was normally expressed on the cell surface of splenocytes from FcRgammac-/- mice whereas PIR-A was not. Cell surface levels of PIR molecules on myeloid and B lineage cells increased with cellular differentiation and activation. Dendritic cells, monocytes/macrophages, and mast cells expressed the PIR molecules in varying levels, but T cells and NK cells did not. These experiments define the coordinate cellular expression of PIR-B, an inhibitory receptor, and PIR-A, an activating receptor; demonstrate the requirement of FcRgammac chain association for cell surface PIR-A expression; and suggest that the level of FcRgammac chain expression could differentially affect the PIR-A/PIR-B equilibrium in different cell lineages.


Figures

Figure 1
Figure 1
Cell surface reactivity of the 6C1 anti-PIR mAb. Mouse LTK cells transfected with the empty vector (A), LTK cells transfected with the PIR-B expression vector (B), M1 myeloblastoid cells (C), and WEHI3 myeloid cells (D) were incubated with 6C1 rat anti-PIR mAb (shaded histogram) or an isotype-matched control mAb (open histogram), before developing with PE-labeled goat antibodies to rat Ig. The stained cells were analyzed by flow cytometry.
Figure 2
Figure 2
Analysis of cell surface and intracellular PIR molecules. Viable splenocytes from normal adult BALB/c mice were radiolabeled with 125I and solubilized in 0.5% NP-40. The cleared membrane lysates were incubated in wells precoated with 6C1 anti-PIR or an isotype-matched control mAb. The bound materials were resolved on SDS-PAGE using 10% acrylamide under nonreducing (not shown) and reducing conditions (A) or digested with or without N-glycanase before SDS-PAGE analysis (B). The same ∼85 and ∼125-kD PIR molecules were observed in splenocytes, purified splenic B cells, and granulocytes (C) as well as the X16C8.5 B cell and WEHI3 macrophage cell lines (D). In contrast, the 85-kD band was identified in PIR-A transfected fibroblasts, while the ∼120-kD band was expressed by the PIR-B transfectants (D). In the experiments shown in C and D, NP-40 lysates of splenocytes, purified B cells, granulocytes, the LTK cells transfected with empty vector or PIR-A1 or PIR-B expression vectors, the X16C8.5 B cell line, and the WEHI3 macrophage cell line were incubated in wells precoated with 6C1 anti-PIR mAb or isotype-matched control mAb (not shown). The bound PIR molecules were separated in SDS-PAGE under nonreducing conditions, transferred onto membranes, and identified with rabbit anti-PIR antiserum and enzyme-labeled goat anti–rabbit Ig antibody before visualization by enhanced chemiluminescence.
Figure 3
Figure 3
Association of PIR-A with FcRγc. (A) Assessment of cell surface PIR-A expression on LTK fibroblasts transfected with PIR-A alone (left) or with PIR-A and FcRγc (right). Viable cells were incubated with fluorochrome-labeled 6C1 anti-PIR (shaded histogram) or isotype-matched control mAb (open histogram). (B) Assessment of PIR expression in FcRγc-deficient versus normal mice. Splenocytes from FcRγc-deficient (FcRγc−/−) or normal (FcRγc+/+) mice were either radiolabeled with 125I (top) or unlabeled (middle and bottom), lysed in 1% NP-40, and subjected to immunoprecipitation (IP) with the indicated mAbs. The immunoprecipitated, radiolabeled materials were resolved by SDS-PAGE and autoradiography (top). The materials isolated from unlabeled cells were resolved by SDS-PAGE, transferred onto membranes, blotted with rabbit anti-PIR (middle) or anti-FcRγc antibodies (bottom), and visualized by chemiluminescence.
Figure 3
Figure 3
Association of PIR-A with FcRγc. (A) Assessment of cell surface PIR-A expression on LTK fibroblasts transfected with PIR-A alone (left) or with PIR-A and FcRγc (right). Viable cells were incubated with fluorochrome-labeled 6C1 anti-PIR (shaded histogram) or isotype-matched control mAb (open histogram). (B) Assessment of PIR expression in FcRγc-deficient versus normal mice. Splenocytes from FcRγc-deficient (FcRγc−/−) or normal (FcRγc+/+) mice were either radiolabeled with 125I (top) or unlabeled (middle and bottom), lysed in 1% NP-40, and subjected to immunoprecipitation (IP) with the indicated mAbs. The immunoprecipitated, radiolabeled materials were resolved by SDS-PAGE and autoradiography (top). The materials isolated from unlabeled cells were resolved by SDS-PAGE, transferred onto membranes, blotted with rabbit anti-PIR (middle) or anti-FcRγc antibodies (bottom), and visualized by chemiluminescence.
Figure 4
Figure 4
Immunofluorescence analysis of cell surface PIR expression. Bone marrow (BM), spleen (SP), and peritoneal lavage (PEC) cells from adult BALB/c mice were incubated first with aggregated human IgG to block FcγR, then stained with a combination of PE-labeled 6C1 anti-PIR and FITC-, CY-, allophycocyanin-, or biotin-labeled (and CY-labeled streptavidin) mAbs with the following specificity: Mac-1 and Gr-1 for myeloid lineage cells (first row); CD43 and B220 antigens for pro-B/pre-B cell compartment (second row); CD19 and IgM for B lineage cells (third row); CD3 and DX5 for T and NK cells and CD19 or Mac-1 for B cells and macrophages (fourth row); B220, CD21, and CD23 for marginal zone (MZ), follicular (FO), and newly formed (NF) B cells (fifth row); CD19, CD5, and Mac-1 for B1 and B2 subpopulations (sixth row). Staining of cells with light scatter characteristics of myeloid cells or small lymphoid and larger mononuclear cells was analyzed by flow cytometry. In the bottom two rows, B220+ or CD19+ B cells were examined for expression of the indicated cell surface antigens. The cell populations indicated by boxes in contour plots were examined for their expression of PIR molecules (solid line) versus background staining with an isotype-matched control mAb (dashed line). MFI indicates mean fluorescence intensity.
Figure 5
Figure 5
PIR expression by thymic and splenic dendritic cells. (Top) Thy-1+ T and B220+ B cells were depleted from thymic cell suspensions by complement-mediated lysis, and the remaining cells were stained with the indicated mAbs. The CD11c+/CD19 cells, which comprised ∼1% of the initial MNC population, were analyzed for the expression of PIR and other cell surface markers (MHC I-Ad, Mac-1, CD8, and FcγRII/ III). (Bottom) Splenocytes were stained similarly, and the CD11c+/CD19 cells analyzed for other cell surface antigens.
Figure 6
Figure 6
PIR expression in FcRγc-deficient and wild-type mice. Bone marrow cells from FcRγc-deficient (thick line) and wild type mice (thin line) were stained with 6C1 anti-PIR or control (dotted line) mAb, and the stained cells were analyzed as described in the legend for Fig. 4. Only the wild-type mice control staining is illustrated.

References

    1. Kubagawa H, Burrows PD, Cooper MD. A novel pair of immunoglobulin-like receptors expressed by B cells and myeloid cells. Proc Natl Acad Sci USA. 1997;94:5261–5266. - PMC - PubMed
    1. Hayami K, Fukuta D, Nishikawa Y, Yamashita Y, Inui M, Ohyama Y, Hikida M, Ohmori H, Takai T. Molecular cloning of a novel murine cell-surface glycoprotein homologous to killer cell inhibitory receptors. J Biol Chem. 1997;272:7320–7327. - PubMed
    1. Maliszewski CR, March CJ, Shoenborn MA, Gimpel S, Shen L. Expression cloning of a human Fc receptor for IgA. J Exp Med. 1990;190:1665–1672. - PMC - PubMed
    1. Colonna M, Samaridis J. Cloning of immunoglobulin-superfamily members associated with HLA-C and HLA-B recognition by human natural killer cells. Science. 1995;268:405–408. - PubMed
    1. Wagtmann N, Biassoni R, Cantoni C, Verdiani S, Malnati MS, Vitale M, Bottino C, Moretta L, Moretta A, Long EO. Molecular clones of the p58 NK cell receptor reveal immunoglobulin-related molecules with diversity in both the extra- and intracellular domains. Immunity. 1995;2:439–449. - PubMed

Publication types