. 1999 Jan 18;189(2):371-80.
doi: 10.1084/jem.189.2.371.

Fcgamma receptor-mediated induction of dendritic cell maturation and major histocompatibility complex class I-restricted antigen presentation after immune complex internalization

Affiliations

Fcgamma receptor-mediated induction of dendritic cell maturation and major histocompatibility complex class I-restricted antigen presentation after immune complex internalization

A Regnault et al. J Exp Med. .

Abstract

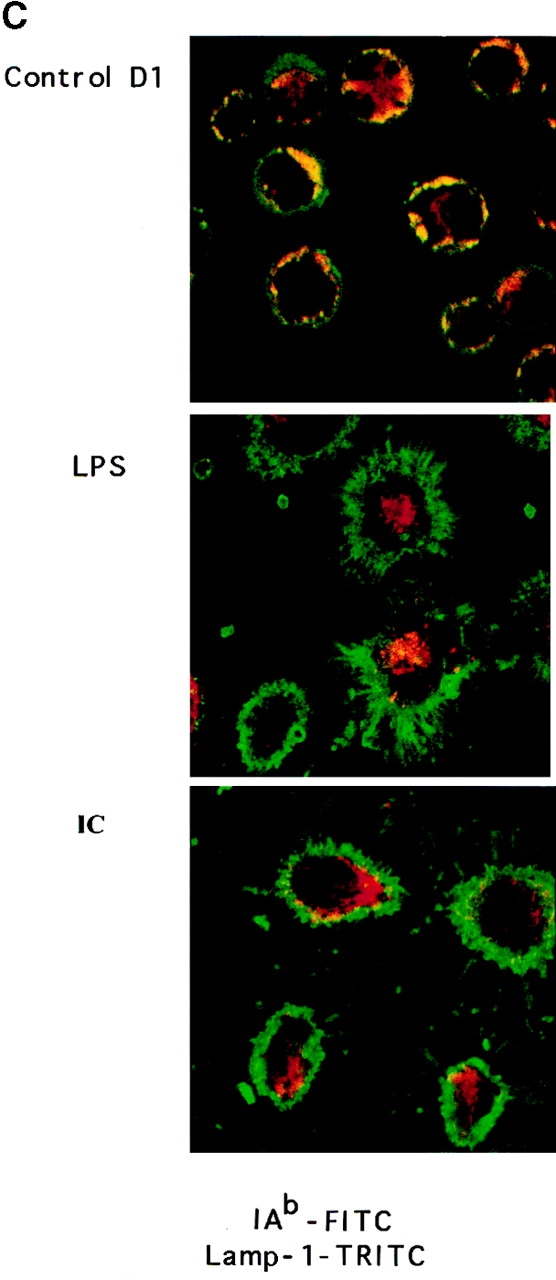
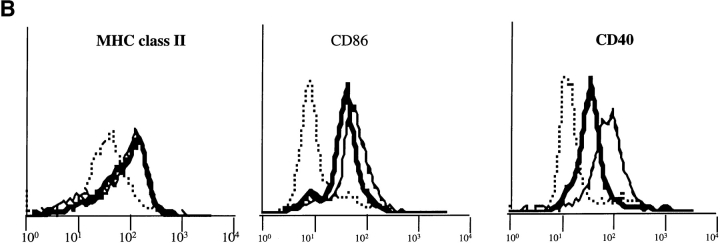
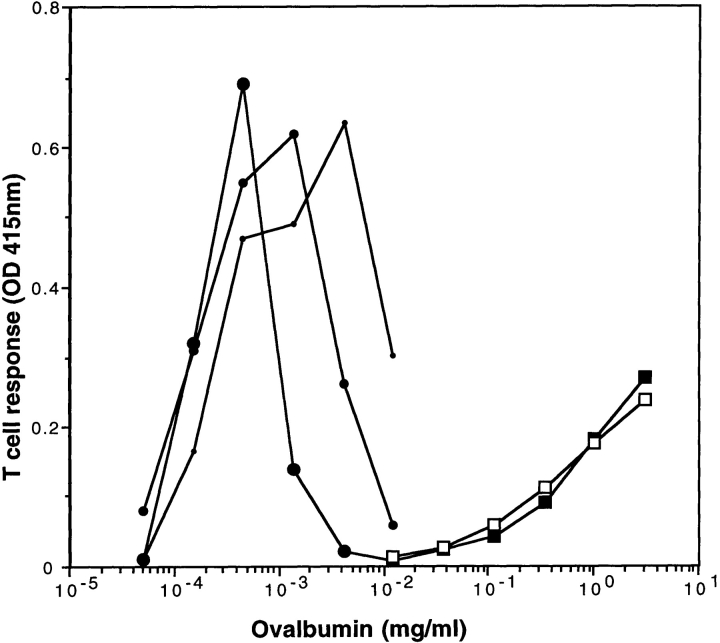
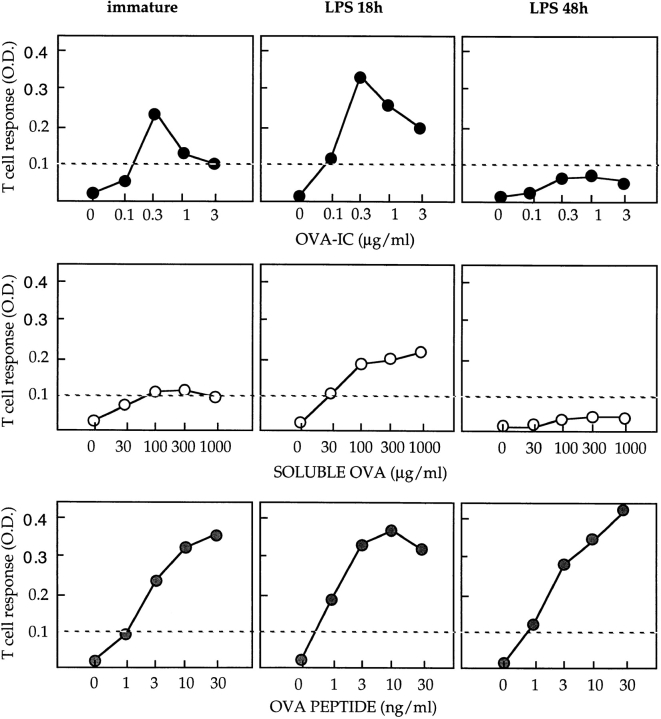
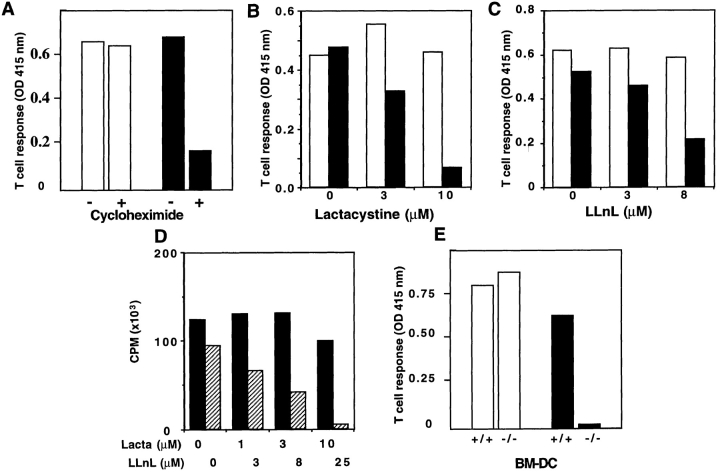
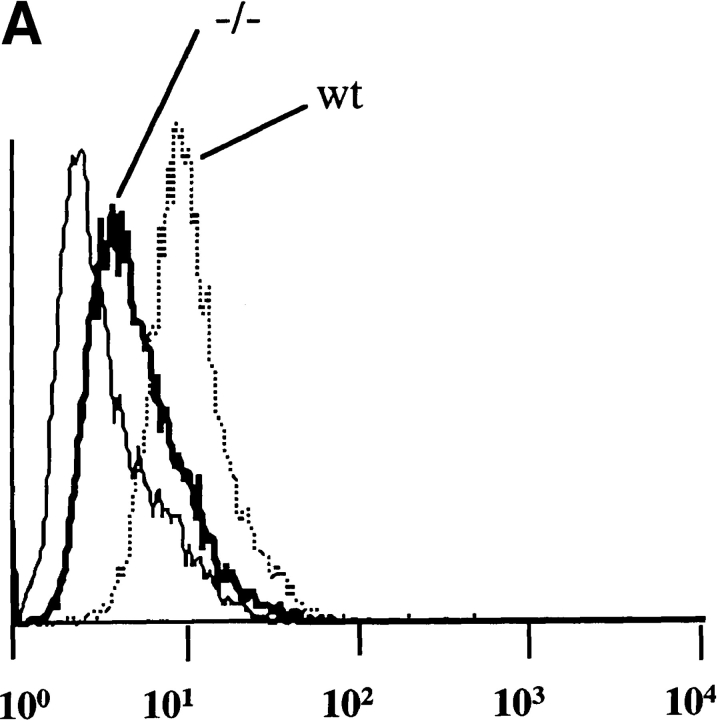
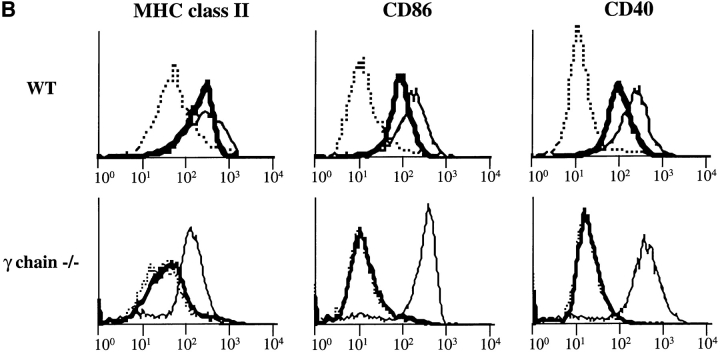
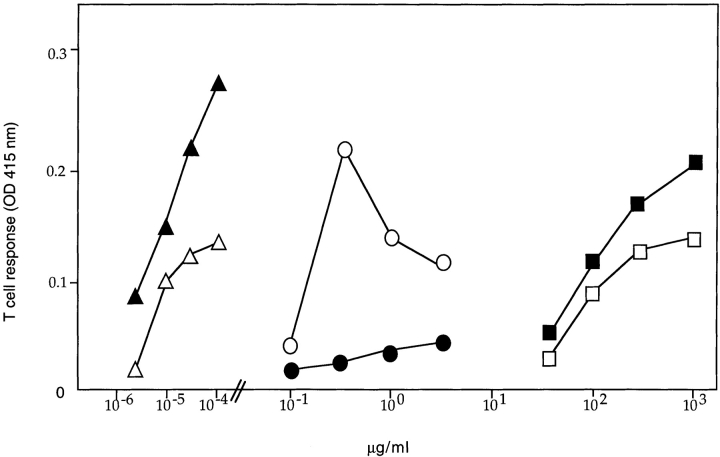
Dendritic cells (DCs) express several receptors for the Fc portion of immunoglobulin (Ig)G (FcgammaR), which mediate internalization of antigen-IgG complexes (immune complexes, ICs) and promote efficient major histocompatibility complex (MHC) class II-restricted antigen presentation. We now show that FcgammaRs have two additional specific attributes in murine DCs: the induction of DC maturation and the promotion of efficient MHC class I-restricted presentation of peptides from exogenous, IgG-complexed antigens. Both FcgammaR functions require the FcgammaR-associated gamma chain. FcgammaR-mediated MHC class I-restricted antigen presentation is extremely sensitive and specific to immature DCs. It requires proteasomal degradation and is dependent on functional peptide transporter associated with antigen processing, TAP1-TAP2. By promoting DC maturation and presentation on both MHC class I and II molecules, ICs should efficiently sensitize DCs for priming of both CD4(+) helper and CD8(+) cytotoxic T lymphocytes in vivo.


Figures

Figure 1
Figure 1
(A) FcγR expression in D1 cells. FcγRII and FcγRIII α chain molecules were immunoprecipitated with 2.4G2 mAb, and FcγRIIb1, b2, and FcγRIII were revealed by Western blot with (+) or without (−) deglycosylation. (B) ICs induce DC maturation. D1 cells were incubated for 24 h alone (dotted line) or in the presence of LPS (solid line) or OVA-ICs (0.4 μg/ml of OVA and 20 μg/ml of rabbit anti-OVA IgGs; bold line). The cells were then stained for MHC class II (Y3P), CD40 (HM40-3), and CD86/B7.2 (GL1) and analyzed by FACscan.® IC- and LPS-treated D1 cells expressed increased surface levels of all three molecules, indicating effective DC maturation. (C) Subcellular distribution of MHC class II molecules. D1 cells were incubated for 24 h in the absence (top) or presence of LPS (middle) or OVA-ICs (bottom). The cells were then fixed, permeabilized, stained, and analyzed by confocal microscopy. MHC class II molecules were visualized (green) using the mAb Y3P and FITC-conjugated secondary antibodies, and lysosomal membrane protein Lamp-1 was visualized (red) using the mAb CD107a and TRITC-conjugated secondary antibody. Yellow, codistribution of the two markers.
Figure 1
Figure 1
(A) FcγR expression in D1 cells. FcγRII and FcγRIII α chain molecules were immunoprecipitated with 2.4G2 mAb, and FcγRIIb1, b2, and FcγRIII were revealed by Western blot with (+) or without (−) deglycosylation. (B) ICs induce DC maturation. D1 cells were incubated for 24 h alone (dotted line) or in the presence of LPS (solid line) or OVA-ICs (0.4 μg/ml of OVA and 20 μg/ml of rabbit anti-OVA IgGs; bold line). The cells were then stained for MHC class II (Y3P), CD40 (HM40-3), and CD86/B7.2 (GL1) and analyzed by FACscan.® IC- and LPS-treated D1 cells expressed increased surface levels of all three molecules, indicating effective DC maturation. (C) Subcellular distribution of MHC class II molecules. D1 cells were incubated for 24 h in the absence (top) or presence of LPS (middle) or OVA-ICs (bottom). The cells were then fixed, permeabilized, stained, and analyzed by confocal microscopy. MHC class II molecules were visualized (green) using the mAb Y3P and FITC-conjugated secondary antibodies, and lysosomal membrane protein Lamp-1 was visualized (red) using the mAb CD107a and TRITC-conjugated secondary antibody. Yellow, codistribution of the two markers.
Figure 2
Figure 2
MHC class I presentation after IC internalization. (A) D1 cells (5 × 10⁴ cells/well) were incubated at 37°C with OVA-ICs, prepared with the indicated concentrations of soluble OVA, and incubated for 15 min at 37°C with 50 (small circles), 25 (medium circles), or 12.5 (large circles) μg/ml of rabbit anti-OVA purified IgGs. In parallel, D1 cells were incubated with soluble OVA (open squares) or soluble OVA and irrelevant ICs (HEL 30 μg/ml, mAbs anti-HEL, HyHEL5, and 5253C7, at 15 μg/ml each; filled squares). D1 cells were then incubated for 24 h in the presence of B3Z cells, a T cell hybridoma specific for OVA-Kb, which carries a β-galactosidase construct driven by NF-AT elements from the IL-2 promoter. T cell activation was measured using a colorimetric assay for LacZ activity with ONPG as a substrate (one representative experiment out of five is shown).
Figure 3
Figure 3
MHC class I–restricted presentation is downmodulated upon LPS-induced DC maturation. C57BL/6 BM-DCs were cultured in the absence (left panels) or presence of LPS (20 μg/ml) for 18 h (center panels) or 48 h (right panels), washed, and incubated for an additional 18-h period with increasing concentrations of OVA-ICs (top panels), soluble OVA (middle panels), or OVA 257–264 peptide (bottom panels) in the presence of B3Z cells. One representative experiment out of three is shown. T cell stimulation was then tested as described above. The efficiency of cross-priming is transiently upregulated and then downmodulated upon DC maturation.
Figure 4
Figure 4
Antigen presentation after IC internalization reaches the conventional MHC class I antigen presentation pathway. (A–C) D1 cells were preincubated alone or in the presence of CHX (3 μg/ml, A) for 3 h or lactacystin (10 μM, B) or LLnL (8 μM, C) for 1 h. Pretreated D1 cells were then incubated for an additional 7-h period with OVA-ICs (0.4 μg/ml of OVA and 20 μg/ml of rabbit anti-OVA IgGs; black bars) or with the 257–264 synthetic peptide (10 ng/ml; white bars) in the presence of the same concentrations of inhibitors. D1 cells were glutaraldehyde fixed before coculture with B3Z cells. (D) MHC class II–restricted presentation after OVA-IC internalization was tested in the presence of lactacystin (black bars) and LLnL (hatched bars) using the T cell hybridoma BO97.10 (specific for OVA 323–339 on I-Ab) on DCs fixed with glutaraldehyde after antigen pulsing. IL-2 production by BO97.10 was measured with [3H]thymidine incorporation by IL-2– dependent CTL.L2 cell line. (E) BM-DCs were generated as described (reference 33) from C57BL/6 or TAP-1–deficient mice and were incubated with 257–264 (SIINFKEL) peptide (10 ng/ml; white bars) or with OVA-ICs (0.4 μg/ml of OVA and 20 μg/ml of anti-OVA rabbit IgGs; black bars) in the presence of B3Z cells for 24 h. Cultures were then treated as described above (one representative experiment out of three is shown).
Figure 5
Figure 5
MHC class I–restricted presentation after OVA-IC internalization is DC specific. D1 cells were tested concurrently with a B cell line expressing recombinant internalization-competent FcγR-ctγ chimeric receptors and supertransfected with cDNA encoding the Kb MHC class I molecule. B lymphoma cells (A and C) and D1 cells (B and D) were incubated with the indicated concentrations of OVA (squares) or OVA complexed to 20 μg/ ml of anti-OVA rabbit polyclonal IgG (OVA-IC; circles). D1 cells were fixed with glutaraldehyde before coculture with T cells. MHC class II–restricted presentation of OVA was tested using the T cell hybridomas BO97.10 (for I-Ab on D1 cells; B) or 54.8 (for I-Ad on B lymphoma cells; A), which both recognize the 323–339 epitope, in association with I-Ab and I-Ad, respectively. MHC class I presentation by B lymphoma cells (C) or D1 cells (D) was tested using B3Z T cell hybridoma as described in the legend to Fig. 2. The 323–339 and 257–264 synthetic peptides (10 μg/ml) were used as positive controls (histograms).
Figure 6
Figure 6
The γ subunit of FcγRs is required for IC-induced DC maturation. (A) 2.4G2 staining in BM-DCs from wt C57BL/6 or γ chain−/− mice. BM-DCs from wt and γ chain−/− mice were stained for FcγRII and III with 2.4G2 mAb before analysis by FACscan®. BM-DCs from wt mice showed stronger surface staining with 2.4G2 than BM-DCs from γ chain−/− mice, suggesting that BM-DCs from wt C57BL/6 mice expressed both FcγRII and III. (B) BM-DCs from γ chain−/− mice are not activated by ICs. BM-DCs from wt and γ chain−/− mice were incubated for 24 h alone (dotted line) or in the presence of LPS (solid line) or OVA-ICs (0.4 μg/ml of OVA and 20 μg/ml of rabbit anti-OVA IgGs; bold line) and stained for MHC class II (Y3P), CD40 (HM40-3), and CD86/B7.2 (GL1) before analysis by FACscan®. BM-DCs from wt mice were activated by both LPS and ICs. In contrast to LPS, OVA-ICs did not induce effective DC maturation in γ chain−/− mice.
Figure 6
Figure 6
The γ subunit of FcγRs is required for IC-induced DC maturation. (A) 2.4G2 staining in BM-DCs from wt C57BL/6 or γ chain−/− mice. BM-DCs from wt and γ chain−/− mice were stained for FcγRII and III with 2.4G2 mAb before analysis by FACscan®. BM-DCs from wt mice showed stronger surface staining with 2.4G2 than BM-DCs from γ chain−/− mice, suggesting that BM-DCs from wt C57BL/6 mice expressed both FcγRII and III. (B) BM-DCs from γ chain−/− mice are not activated by ICs. BM-DCs from wt and γ chain−/− mice were incubated for 24 h alone (dotted line) or in the presence of LPS (solid line) or OVA-ICs (0.4 μg/ml of OVA and 20 μg/ml of rabbit anti-OVA IgGs; bold line) and stained for MHC class II (Y3P), CD40 (HM40-3), and CD86/B7.2 (GL1) before analysis by FACscan®. BM-DCs from wt mice were activated by both LPS and ICs. In contrast to LPS, OVA-ICs did not induce effective DC maturation in γ chain−/− mice.
Figure 7
Figure 7
BM-DCs derived from γ chain−/− mice fail to present peptides derived from OVA-ICs on MHC class I molecules. C57BL/6 (open symbols) or γ chain−/− BM-DCs (filled symbols) were incubated in the presence of the indicated concentrations of soluble OVA (squares), OVA-ICs (20 μg/ml rabbit IgG anti-OVA; circles), or 257–264 peptide (triangles) for 18 h in the presence of B3Z T cells. Antigen presentation was quantified as described above. One representative of three experiments is shown.

References

    1. Townsend A, Bodmer H. Antigen recognition by class I-restricted T lymphocytes. Annu Rev Immunol. 1989;7:601–624. - PubMed
    1. Huang AYC, Golumbeck P, Ahmadzadeh M, Jaffee A, Pardoll DM, Levitsky HI. Role of bone marrow-derived cells in presenting MHC class I-restricted tumor antigens. Science. 1994;264:961–965. - PubMed
    1. Bevan MJ. Cross-priming for a secondary cytotoxic response to minor H antigens with H-2 congenic cells which do not cross-react in cytotoxic assay. J Exp Med. 1976;143:1283–1288. - PMC - PubMed
    1. Albert ML, Sauter B, Bhardwaj N. Dendritic cells acquire antigen from apoptotic cells and induce class I-restricted CTLs. Nature. 1998;392:86–89. - PubMed
    1. Hart DNJ. Dendritic cells: unique leukocyte populations which control the primary immune response. Blood. 1997;90:3245–3287. - PubMed

Publication types

MeSH terms