. 1999 Jan 19;96(2):736-41.
doi: 10.1073/pnas.96.2.736.

Morphological, physiological, and biochemical changes in rhodopsin knockout mice

Affiliations

Morphological, physiological, and biochemical changes in rhodopsin knockout mice

J Lem et al. Proc Natl Acad Sci U S A. .

Abstract

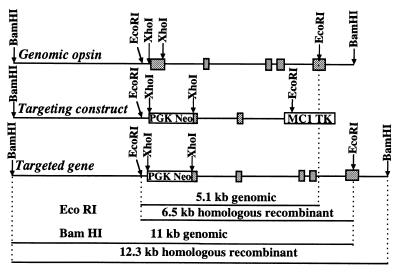
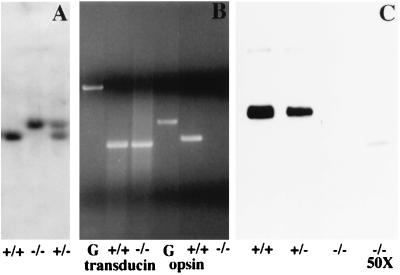
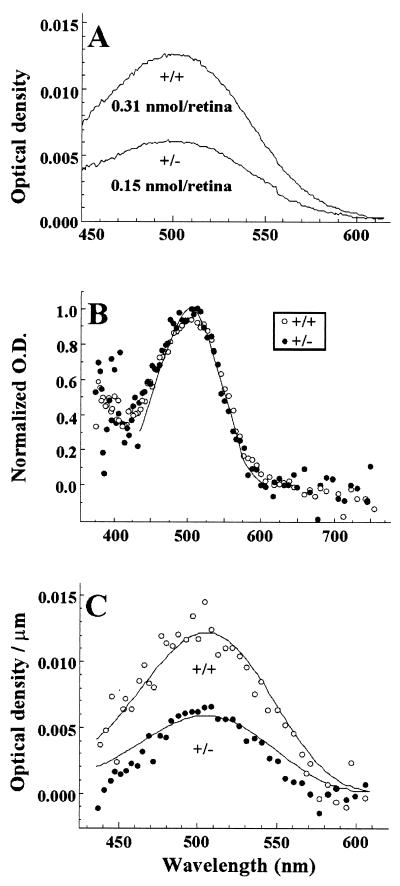
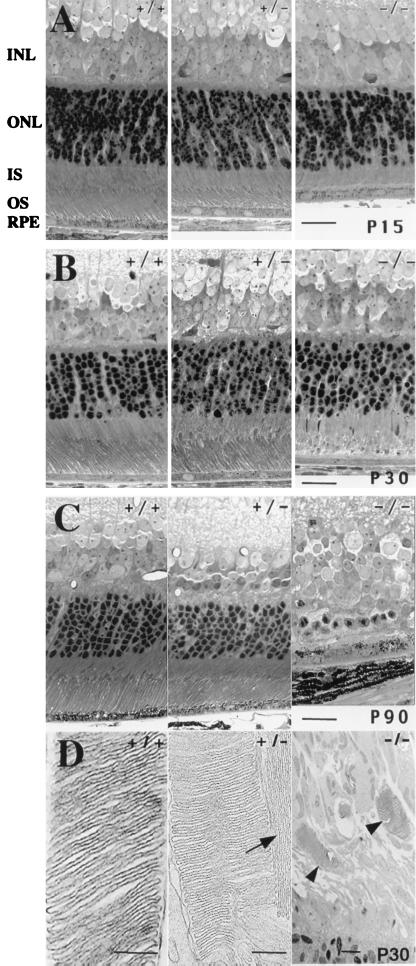
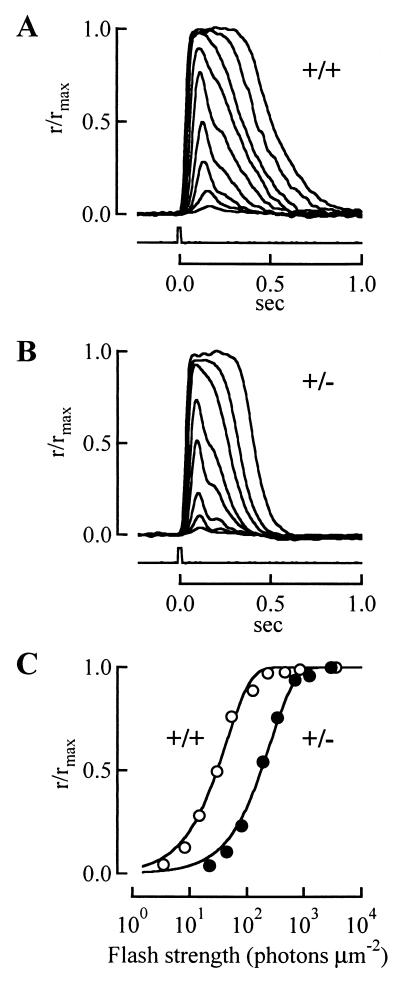
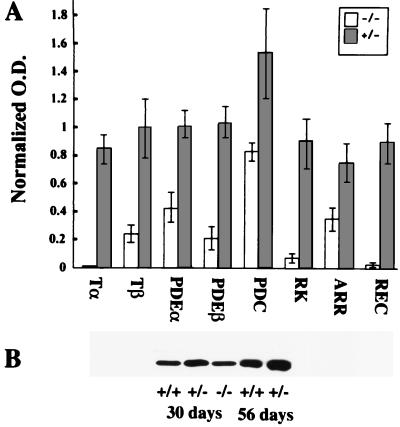
Mutations in rod opsin, the visual pigment protein of rod photoreceptors, account for approximately 15% of all inherited human retinal degenerations. However, the physiological and molecular events underlying the disease process are not well understood. One approach to this question has been to study transgenic mice expressing opsin genes containing defined mutations. A caveat of this approach is that even the overexpression of normal opsin leads to photoreceptor cell degeneration. To overcome the problem, we have reduced or eliminated endogenous rod opsin content by targeted gene disruption. Retinas in mice lacking both opsin alleles initially developed normally, except that rod outer segments failed to form. Within months of birth, photoreceptor cells degenerated completely. Retinas from mice with a single copy of the opsin gene developed normally, and rods elaborated outer segments of normal size but with half the normal complement of rhodopsin. Photoreceptor cells in these retinas also degenerated but did so over a much slower time course. Physiological and biochemical experiments showed that rods from mice with a single opsin gene were approximately 50% less sensitive to light, had accelerated flash-response kinetics, and contained approximately 50% more phosducin than wild-type controls.


Figures

Figure 1
Figure 1
The targeting construct was produced by replacing the DNA segment between the XhoI sites of genomic opsin with the neomycin-resistance gene (PGK Neo) and inserting the thymidine kinase gene (MC1 TK) in the second intron. Codons 1–111 were deleted in the targeted opsin gene. Desired homologous recombinants were identified by using the two restriction-digestion strategies shown at the bottom of the figure.
Figure 2
Figure 2
(A) Southern blot with EcoRI-digested DNAs prepared from littermate animals derived from a chimeric rhodopsin knockout founder. +/+, −/−, and +/− designate wild-type, homozygous, and hemizygous mice, respectively. +/+ mice exhibit a 5.1-kb band indicative of genomic opsin DNA. −/− mice exhibit a 6.5-kb band indicative of the targeted gene. +/− mice exhibit both. (B) Reverse transcription–PCR. RNA prepared from retinas of 30-day-old +/+ or +/− mice were reverse transcribed and amplified with primers specific for rod Tα or rod opsin. Primer pairs spanned an intron. Although Tα mRNA was detected, no opsin mRNA was detected in −/− retinas. Transducin PCR products were 370 bp and 846 bp for RNA and DNA, respectively. Opsin PCR products were 397 bp and 513 bp for RNA and DNA, respectively. G represents amplified genomic DNA. (C) Western blot probed with rhodopsin-specific Ret-P1 antibody. Equivalent amounts of retinal homogenate were loaded in the first three lanes (left to right); 50-fold more homogenate was loaded in the far right lane.
Figure 3
Figure 3
(A) Difference spectra of retinal extracts. +/− retinal homogenates have approximately half the rhodopsin content of age-matched (4 week) +/+ retinas. (B) Normalized mean absorption spectra of rod masses from +/+ (open circles; n = 6) and +/− (closed circles; n = 5) mice. Fitting the template to the +/+ spectrum yielded an absorption peak (λmax) of ≈505 nm. (C) Microspectrophotometric analysis of single rods. The OD spectrum for each rod was divided by the width (in μm) of the rod’s outer segment. Circles plot the mean specific absorbance values for 30 +/+ rods (open circles) and 32 +/− rods (closed circles). The lines show the template in B, scaled to fit the +/+ and +/− results.
Figure 4
Figure 4
Retinal morphology. Light microscopy shows retinas of 15-day-old (A), 30-day-old (B), and 90-day-old (C) animals (Left, +/+ littermate mice; Center, +/− littermate mice; Right, −/− littermate mice). INL, inner nuclear layer; ONL, outer nuclear layer; IS, inner segments; OS, outer segments; RPE, retinal pigmented epithelium. (Bar = 20 μm.) (D) Electron micrographs were prepared from the same tissue blocks used for light microscopy. The arrow indicates abnormally oriented membranes. Arrowheads point to outer segments in the −/− retina. (Bar = 200 nm for +/+ and +/−; bar = 1 μm for −/−.)
Figure 5
Figure 5
Averaged responses of +/+ rods (A) and +/− rods (B) to 500-nm flashes of increasing strength. Responses are normalized to maximal response amplitudes (18 pA for the +/+ rod and 12 pA for the +/− rod). Traces underneath are signals from flash monitors. Photoresponse recovery is faster in the +/− rod. (C) Normalized response amplitudes from A and B plotted against flash strength. Lines show fit of the data to a saturating exponential: r/rmax = 1 − e−ki, where i is the flash strength, k = ln(2/i0), and i0 is the flash strength giving rise to a half-maximal response. For the +/+ rod, i0 was 30.6 photons⋅μm−2; for the +/− rod, i0 was 182 photons⋅μm−2.
Figure 6
Figure 6
(A) Levels of Tα, Tβ, PDEα, PDEβ, phosducin (PDC), rhodopsin kinase (RK), arrestin (ARR), and recoverin (REC) in −/− (open bars) and +/− (gray bars) mice normalized to +/+ values (mean ± SD). (B) This Western blot with equal amounts of retinal homogenate from +/+, +/−, and −/− mice at 30 and 56 days of age was probed with phosducin antibody.

Similar articles

Cited by

References

    1. Gal A, Apfelstedt-Sylla E, Janecke A R, Zrenner E. Prog Retin Eye Res. 1997;16:51–79.
    1. Chen J, Makino C L, Peachey N S, Baylor D A, Simon M I. Science. 1995;267:374–377. - PubMed
    1. Li T, Franson W K, Gordon J W, Berson E L, Dryja T P. Proc Natl Acad Sci USA. 1995;92:3551–3555. - PMC - PubMed
    1. Li T, Snyder W K, Olsson J E, Dryja T P. Proc Natl Acad Sci USA. 1996;93:14176–14181. - PMC - PubMed
    1. Sung C-H, Makino C, Baylor D, Nathans J. J Neurosci. 1994;14:5818–5833. - PMC - PubMed

Publication types

LinkOut - more resources