. 1999 Jan 19;96(2):790-4.
doi: 10.1073/pnas.96.2.790.

The effect of antibody-dependent enhancement on the transmission dynamics and persistence of multiple-strain pathogens

Affiliations

The effect of antibody-dependent enhancement on the transmission dynamics and persistence of multiple-strain pathogens

N Ferguson et al. Proc Natl Acad Sci U S A. .

Abstract

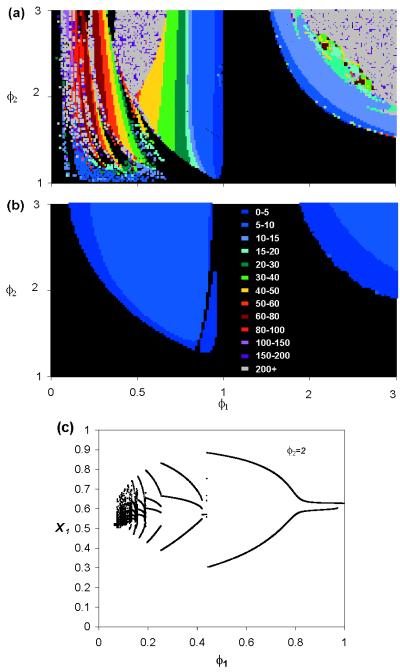
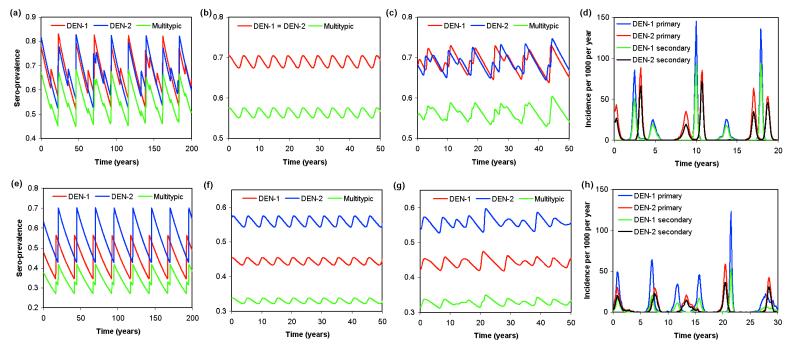
Cross-reactive antibodies produced by a mammalian host during infection by a particular microparasitic strain usually have the effect of reducing the probability of the host being infected by a different, but closely related, pathogen strain. Such cross-reactive immunological responses thereby induce between-strain competition within the pathogen population. However, in some cases such as dengue virus, evidence suggests that cross-reactive antibodies act to enhance rather than restrict the severity of a subsequent infection by another strain. This cooperative mechanism is thought to explain why pre-existing immunity to dengue virus is an important risk factor for the development of severe disease (i.e., dengue shock syndrome and dengue hemorrhagic fever). In this paper, we explore the effect of antibody-dependent enhancement on the transmission dynamics of multistrain pathogen populations. We show that enhancement frequently may generate complex and persistent cyclical or chaotic epidemic behavior. Furthermore, enhancement acts to permit the coexistence of all strains where in its absence only one or a subset would persist.


Figures

Figure 1
Figure 1
(a) Isoperiodic diagram of deterministic model, indicating nature of model dynamics, as a function of degree, φi, of ADE for each of two strains. Color designates period of epidemic cycle (in years), with black indicating equilibrium coexistence (no cycles). Note that because the system is symmetrical between the strains, φ1 is varied between 0 and 3, and φ2 only between 1 and 3. No cycles are seen for the case when both φ1 and φ2 are negative. Parameters: R01 = R02 = 2, the recovery rate is σ = 100/yr, and host life span 1/μ = 50 yr. No background force of infection (λ0 = 0). For most points where the period is plotted as over 200 yr, the dynamics are chaotic. (b) As in a, but with λ0 = 10−5 (5 infectives/million per yr). (c) Bifurcation diagram plotting the local maxima of x1 against φ1 (for values of φ1 where limit cycles exist), with φ1 being varied between 0 and 1. φ2 = 2 and other parameters as in a. This diagram represents a horizontal slice through the left-hand half of a showing a complex cascade of bifurcations, with limit cycle regions interspersed by chaotic regimes. Integration of the deterministic model used the Bulirsch-Stoer method for maximum numerical accuracy, with randomly chosen (nonsymmetrical) initial conditions. Convergence to any equilibrium point or limit cycle was ensured by discarding the first 10,000 yr of each resulting time series.
Figure 2
Figure 2
(ac) Sero-prevalence time series for system with R01 = R02 = 2, σ = 100/yr, 1/μ = 50 yr, φ1 = φ2 = 2.5. (a) Deterministic model, with λ0 = 0. Note that the dynamics are chaotic with a quasi-period of about 25 yr. A symmetry-breaking bifurcation has given rise to partially nonsynchronized oscillations of the two strains. (b) Deterministic model with λ0 = 10−6. The background force of infection eliminates large-amplitude limit cycle or chaotic attractors, simplifying the dynamics and restoring exact synchronization of the oscillations of both strains. (c) Stochastic model with λ0 = 10−6. The dynamics show the “ghost” of the deterministic chaotic attractor from a modifying the simple limit cycles dynamics of b. (d) As in c but showing infection incidence. (eh) As in a–d, but with φ1 = 0.75 and φ2 = 1.5. Dynamical trends are similar to the pure ADE case, but average prevalences now differ and the limit cycles of the two strains are never now in phase.
Figure 3
Figure 3
(a) Dependence of epidemic period (in yr) on R0 of strains and recovery rate, σ, for deterministic model with 1/μ = 50 yr, R01 = R02, φ1 = 0.8, φ2 = 2, and λ0 = 10−6. (b) Numbers of cases associated with the four serotypes as reported by Briseno-Garcia et al. (21) for the period 1982–1995 in Mexico.

Similar articles

Cited by

References

    1. Adler F R, Brunet R C. Theor Popul Biol. 1991;40:369–410. - PubMed
    1. Gupta S, Swinton J, Anderson R M. Proc R Soc London Ser B. 1994;256:231–238. - PubMed
    1. Gupta S, Maiden M C J, Feavers I M, Nee S, May R M, Anderson R M. Nat Med. 1996;2:437–442. - PubMed
    1. Andreasen V, Lin J, Levin S A. J Math Biol. 1997;35:825–842. - PubMed
    1. Gupta S, Ferguson N M, Anderson R M. Science. 1998;280:912–915. - PubMed

Publication types

LinkOut - more resources