

Assessment of genetic changes in hepatocellular carcinoma by comparative genomic hybridization analysis: relationship to disease stage, tumor size, and cirrhosis
- PMID: 9916916
- PMCID: PMC1853447
- DOI: 10.1016/S0002-9440(10)65248-0
Assessment of genetic changes in hepatocellular carcinoma by comparative genomic hybridization analysis: relationship to disease stage, tumor size, and cirrhosis
Abstract
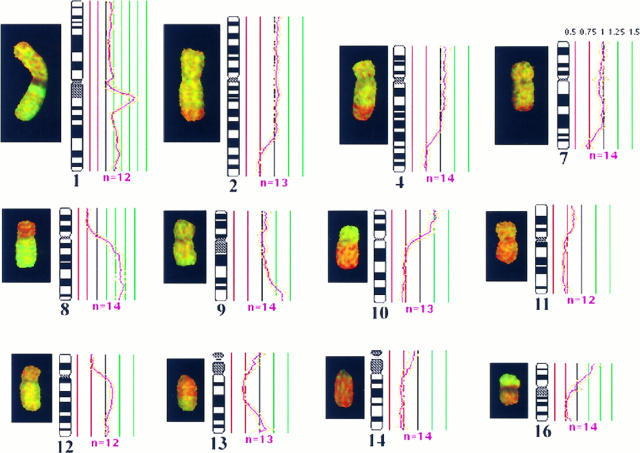
Hepatocellular carcinoma (HCC) is a common and highly malignant tumor that is prevalent in Southeast Asia. Although the etiological factors associated are now well recognized, the interactions between individual factors and the molecular mechanisms by which they lead to cancer remain unclear. Cytogenetic analysis on HCC has been limited because of poor hepatocyte growth in vitro. The recently developed technique of comparative genomic hybridization (CGH), however, permits screening of the entire genome without the need of cell culture. CGH was applied to the study of genomic aberrations in 67 surgically resected samples of HCC, 3 of adenomatous hyperplasia (AH), and 12 of nontumorous cirrhotic liver surrounding the tumors. All samples were from patients of a racially and etiologically homogeneous population in Southern China, where chronic hepatitis B virus infection is the main etiological factor. CGH analysis of the HCC samples revealed frequent copy number gain of 1q (48/67 cases, 72%), 8q (32/67 cases, 48%), 17q (20/67 cases, 30%), and 20q (25/67 cases, 37%) and common losses on 4q (29/67 cases, 43%), 8p (25/67 cases, 37%), 13q (25/67 cases, 37%), and 16q (20/67 cases, 30%). Our finding of a high incidence of 1q gain strongly suggested this aberration was associated with the development of HCC. Genomic abnormalities were detected in 1 of the 3 AH specimens but absent in all 12 cirrhotic tissues surrounding the tumor. Clinical staging classified 3/67 HCC cases as T1, 53 cases as T2, and 11 cases as T3. No significant difference in the pattern of genomic imbalances was detected between stages T2 and T3. A significant copy number loss of 4q11-q23 was, however, identified in those tumors larger than 3 cm in diameter. Of particular interest was the identification of 8q copy number gain in all 12 cases of HCC that arose in a noncirrhotic liver, compared with only 20/55 cases in HCC arising in a cirrhotic liver. We suggest that 8q over-representation is likely associated with a growth advantage and proliferative stimulation that have encouraged malignant changes in the noncirrhotic human liver.
Figures

Similar articles
-
Molecular cytogenetic evaluation of virus-associated and non-viral hepatocellular carcinoma: analysis of 26 carcinomas and 12 concurrent dysplasias.J Pathol. 2000 Oct;192(2):207-15. doi: 10.1002/1096-9896(2000)9999:9999<::AID-PATH690>3.0.CO;2-#. J Pathol. 2000. PMID: 11004697
-
Recurrent chromosome alterations in hepatocellular carcinoma detected by comparative genomic hybridization.Genes Chromosomes Cancer. 2000 Oct;29(2):110-6. Genes Chromosomes Cancer. 2000. PMID: 10959090
-
Marked genetic similarities between hepatitis B virus-positive and hepatitis C virus-positive hepatocellular carcinomas.J Pathol. 2000 Nov;192(3):307-12. doi: 10.1002/1096-9896(2000)9999:9999<::AID-PATH706>3.0.CO;2-O. J Pathol. 2000. PMID: 11054713
-
Cytogenetic and molecular genetic alterations in hepatocellular carcinoma.Acta Pharmacol Sin. 2005 Jun;26(6):659-65. doi: 10.1111/j.1745-7254.2005.00126.x. Acta Pharmacol Sin. 2005. PMID: 15916730 Review.
-
Cytogenetic alterations in liver cell tumors as detected by comparative genomic hybridization.Pathologica. 2003 Apr;95(2):71-82. Pathologica. 2003. PMID: 12768875 Review.
Cited by
-
Interaction of major genes predisposing to hepatocellular carcinoma with genes encoding signal transduction pathways influences tumor phenotype and prognosis.World J Gastroenterol. 2008 Nov 21;14(43):6601-15. doi: 10.3748/wjg.14.6601. World J Gastroenterol. 2008. PMID: 19034960 Free PMC article.
-
CKS1B promotes the progression of hepatocellular carcinoma by activating JAK/STAT3 signal pathway.Anim Cells Syst (Seoul). 2021 Jul 14;25(4):227-234. doi: 10.1080/19768354.2021.1953142. eCollection 2021. Anim Cells Syst (Seoul). 2021. PMID: 34408811 Free PMC article.
-
Regulation of DNA repair by S-nitrosylation.Biochim Biophys Acta. 2012 Jun;1820(6):730-5. doi: 10.1016/j.bbagen.2011.04.014. Epub 2011 May 5. Biochim Biophys Acta. 2012. PMID: 21571039 Free PMC article. Review.
-
Copy number gain of granulin-epithelin precursor (GEP) at chromosome 17q21 associates with overexpression in human liver cancer.BMC Cancer. 2015 Apr 11;15:264. doi: 10.1186/s12885-015-1294-x. BMC Cancer. 2015. PMID: 25885205 Free PMC article.
-
Genomic shotgun array: a procedure linking large-scale DNA sequencing with regional transcript mapping.Nucleic Acids Res. 2004 Feb 11;32(3):e27. doi: 10.1093/nar/gnh025. Nucleic Acids Res. 2004. PMID: 14960710 Free PMC article.
References
-
- World Health Organization: Cancer Research for Cancer Control. International Agency for Cancer Research, Lyon (IARC Scientific Publication), 1997, p 5
-
- Doll R, Muir C, Waterhouse J: Cancer Incidence in Five Continents, 1970, vol 2. Springer, Berlin
-
- Waterhouse JAH, Muir CS, CoRrea P, Powell J: Cancer Incidence in Five Continents, vol 4. International Agency for Research on Cancer, Lyon (IARC Scientific Publications 42), 1982
-
- Beasley RP: Hepatitis B virus: the major etiology of hepatocellular carcinoma. Cancer 1988, 61:1942-1946 - PubMed
-
- Munoz N, Bosch X: Epidemiology of hepatocellular carcinoma. Neoplasms of the Liver. 1987, Ishak KG. London, Springer Verlag, Edited by Okuda K
Publication types
MeSH terms
LinkOut - more resources
Full Text Sources
Other Literature Sources
Medical
