

doi: 10.1006/dbio.1998.9035.
Heterogeneity of neural progenitor cells revealed by enhancers in the nestin gene
Affiliations
- PMID: 9917366
- PMCID: PMC3938161
- DOI: 10.1006/dbio.1998.9035
Item in Clipboard
Heterogeneity of neural progenitor cells revealed by enhancers in the nestin gene
Dev Biol.
.
Abstract
Using transgenic embryos, we have identified two distinct CNS progenitor cell-specific enhancers, each requiring the cooperation of at least two independent regulatory sites, within the second intron of the rat nestin gene. One enhancer is active throughout the developing CNS, while the other is specifically active in the ventral midbrain. These experiments demonstrate that neural progenitor cells in the midbrain constitute a unique subpopulation based upon their ability to activate the midbrain regulatory element. Our finding of differential enhancer activity from a gene encoding a structural protein reveals a previously unrecognized diversity in neural progenitor cell populations.
Copyright 1999 Academic Press.
Figures

The LacZ gene is linked to the minimal IE gene promoter and is represented schematically as an open box, the solid dark line indicates the nestin enhancer. Numbering for the 1.85 kb BstYI fragment from plasmid pNesIx (for Constructs 1–19) and for the 1.73 kb PCR product cloned in plasmid pHNes (for Construct 20), is identical to the sequence entries in GenBank under accession numbers AF004334 (rat) and AF004335 (human). Four DNA regulatory elements have been identified and are indicated with colored triangles: midbrain-specific element, blue; general transcriptional potentiator, yellow; CNS element I, green; CNS element II, red. All enhancer fragments are in the 5′-3′ orientation unless indicated otherwise by an arrow (Constructs 8 and 12). The number of embryos isolated and examined for enhancer activity at 10.5 dpc is indicated; the transgene positive column shows how many of these embryos carried the LacZ transgene, as determined by PCR screening of yolk sac DNA. Central nervous system β–galactosidase activity was divided into two categories: either the full CNS stained (marked under the column “entire”) or only cells of the midbrain stained (under the column “MB”). Embryos which stained outside of the nervous system were scored as ectopic. The asterisk under the “MB” column with Construct 12 indicates that although the midbrain stained in 1 embryo, staining was also present at non-specific sites such as the heart, limbs, skin and additional neural tissue and was therefore scored as ectopic.
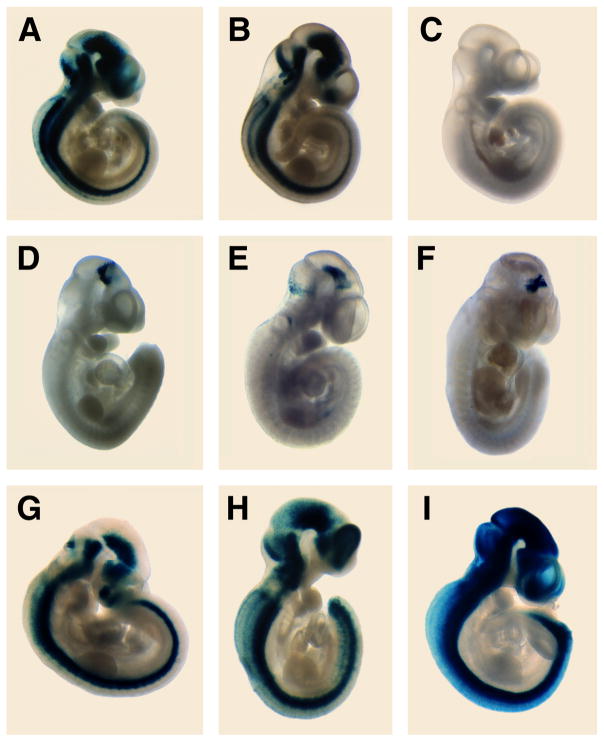
Embryos were isolated at 10.5 dpc and assayed for β–galactosidase activity. Reprentative embryos are depicted for A: construct 1; B: construct 4; C: construct 5; D: construct 8; E: construct 10; F: construct 11; G: construct 15; H: construct 19; I: construct 20. Consistently, three staining patterns emerged: the entire developing CNS was positive (A, B, G–I), or ventral midbrain only (D–F), or the neuroepithelium was negative (C).
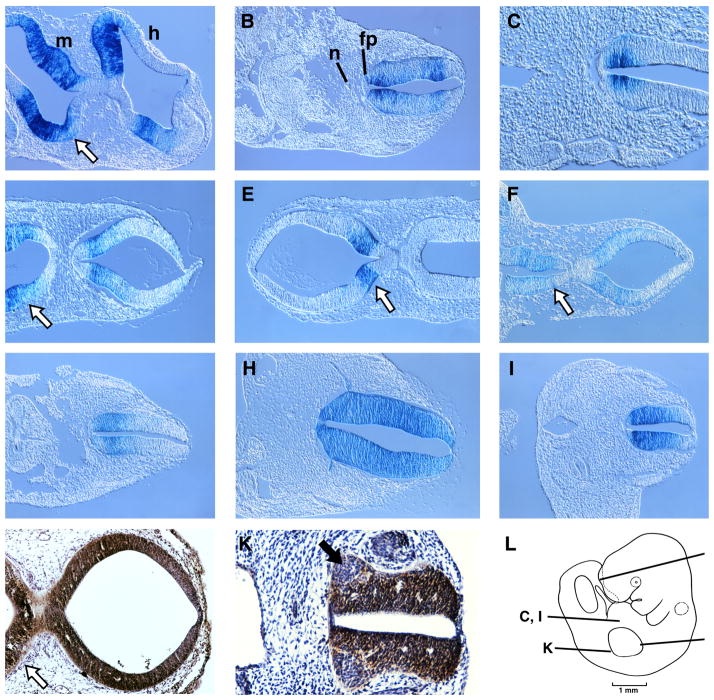
Histologic cross and transverse sections were obtained from either LacZ-stained transgenic embryos (A–I) or from normal control embryos (J–K) at a thickness of 10 μm. A schematic of a 10.5 dpc embryo showing the sectioning planes is presented in panel L. Midbrain, m; hindbrain, h; notochord, n; floor plate, fp. Dorsal is to the right. A–C: construct 1; D: construct 4; E: construct 8; F–G: construct 19; H–I: construct 20; J–K: immunohistochemistry for nestin. In the developing brain, β–galactosidase activity is detected in stripes in both the midbrain and hindbrain (A, D, F), however, only midbrain cells were targeted with construct 8 (E). Midbrain cells are indicated with a white arrow (A, D–F, J). In the anterior spinal cord, enhancer activity is observed in both ventral and dorsal cells with strong ventricular cell localization (B, G, H). Staining becomes more ventrally restricted in posterior spinal cord (C, I). Nestin immunoreactivity is uniform throughout the hindbrain and midbrain (J) and the posterior spinal cord (K), except in areas where presumptive motor neurons have differentiated (black arrow). Immunoreactivity was also detected in notochord, dorsal root ganglia, and endothelial walls of blood vessels. Some axonal projections were detected by either enhancer activity (I) or by nestin protein detection (K).
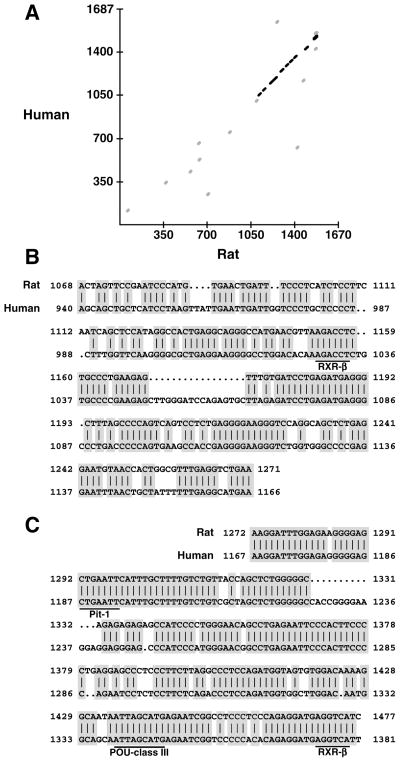
Sequencing was performed by an ABI automatic sequencer. A: comparison between the two intron sequences was performed using the Complign program of McMolly Tetra (3.5) with minimal match length: 10; mismatches: 0; and gap penalty: 3. The sequences are overall 37% similar with the highest region of similarity clustered in the last third of the intron. B, C: sequence alignments were performed using the Bestfit program of GCG. B: The sequences of the midbrain enhancer from rat (upper) and human (lower) are 72% similar. C: The CNS-enhancer sequences are 85% similar. Sequence identities are shaded, and putative transcription factor binding sites are underlined and labeled. Numbering is identical to the intron sequences deposited in GenBank under accession numbers AF004334 (rat) and AF004335 (human).

A schematic representation of a transverse section through the third and fourth ventricles of a 10.5 dpc embryo is shown. Dorsal is on the right. Colors indicate cells that activate the midbrain-enhancer (A) or the CNS enhancer (B). C depicts cells that express nestin protein. The comparison identifies three populations of neuroepithelial cells: Population 1 is nestin+/CNS-enhancer+/MB-enhancer+; population 2 is nestin+/CNS enhancer+/MB-enhancer−; and population 3 is nestin+/enhancer−.
References
-
- Bayer SA, Wills KV, Triarhou LC, Ghetti B. Time of neuron origin and gradients of neurogenesis in midbrain dopaminergic neurons in the mouse. Exp Brain Res. 1995;105:191–199. - PubMed
-
- Brüstle O, Maskos U, McKay RD. Host-guided migration allows targeted introduction of neurons into the embryonic brain. Neuron. 1995;15:1275–1285. - PubMed
-
- Campbell K, Olsson M, Björklund A. Regional incorporation and site-specific differentiation of striatal precursors transplanted to the embryonic forebrain ventricle. Neuron. 1995;15:1259–1273. - PubMed
-
- Clarke SR, Shetty AK, Bradley JL, Turner DA. Reactive astrocytes express the embryonic intermediate neurofilament nestin. NeuroReport. 1994;5:1885–1888. - PubMed
Publication types
MeSH terms
Substances
Associated data
- Actions
- Actions
Grants and funding
LinkOut - more resources
Full Text Sources
Other Literature Sources
Medical
Molecular Biology Databases
