. 1999 Jan 25;144(2):241-54.
doi: 10.1083/jcb.144.2.241.

Ca2+-induced Ca2+ release in chromaffin cells seen from inside the ER with targeted aequorin

Affiliations

Ca2+-induced Ca2+ release in chromaffin cells seen from inside the ER with targeted aequorin

M T Alonso et al. J Cell Biol. .

Abstract

The presence and physiological role of Ca2+-induced Ca2+ release (CICR) in nonmuscle excitable cells has been investigated only indirectly through measurements of cytosolic [Ca2+] ([Ca2+]c). Using targeted aequorin, we have directly monitored [Ca2+] changes inside the ER ([Ca2+]ER) in bovine adrenal chromaffin cells. Ca2+ entry induced by cell depolarization triggered a transient Ca2+ release from the ER that was highly dependent on [Ca2+]ER and sensitized by low concentrations of caffeine. Caffeine-induced Ca2+ release was quantal in nature due to modulation by [Ca2+]ER. Whereas caffeine released essentially all the Ca2+ from the ER, inositol 1,4, 5-trisphosphate (InsP3)- producing agonists released only 60-80%. Both InsP3 and caffeine emptied completely the ER in digitonin-permeabilized cells whereas cyclic ADP-ribose had no effect. Ryanodine induced permanent emptying of the Ca2+ stores in a use-dependent manner after activation by caffeine. Fast confocal [Ca2+]c measurements showed that the wave of [Ca2+]c induced by 100-ms depolarizing pulses in voltage-clamped cells was delayed and reduced in intensity in ryanodine-treated cells. Our results indicate that the ER of chromaffin cells behaves mostly as a single homogeneous thapsigargin-sensitive Ca2+ pool that can release Ca2+ both via InsP3 receptors or CICR.


Figures
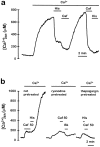
Figure 1
Figure 1
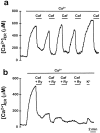
Effects of histamine and caffeine and pretreatment with ryanodine or thapsigargin on [Ca2+]ER. HSV-1–infected chromaffin cells were depleted of Ca2+ and reconstituted with coelenterazine n. (a) The ER was refilled by incubation with medium containing 1 mM Ca2+, then either 10 μM histamine or 50 mM caffeine were perfused as indicated. (b) Where indicated, ryanodine-pretreated cells were treated before aequorin reconstitution with medium containing 50 mM caffeine and 10 μM ryanodine for 2 min. Cells were then washed and the same treatment was repeated four times at 2-min intervals. Where indicated, thapsigargin-pretreated cells were incubated with 1 μM thapsigargin for 10 min before starting the record. During the experiments, medium containing 1 mM Ca2+ and either 50 mM caffeine, 1 μM bradykinin, or 10 μM histamine was perfused as indicated.
Figure 2
Figure 2
Use-dependent inhibition of ER refilling by ryanodine. The ER was refilled by perfusing with medium containing 1 mM Ca2+. Then, several consecutive stimulations with 50 mM caffeine were performed as indicated, either in the absence (a) or in the presence (b) of 10 μM ryanodine. In b, standard medium containing 70 mM KCl (replacing an equimolar amount of NaCl) was perfused when indicated (K+). Other details are as in Fig. 1.
Figure 3
Figure 3
Quantal response to submaximal concentrations of caffeine. The ER was refilled by perfusing with medium containing 1 mM Ca2+ either in the presence (b) or in the absence of caffeine. Then, different concentrations of caffeine were added as indicated, either in the presence or in the absence of 10 μM ryanodine. Other details are as in Fig. 1.
Figure 4
Figure 4
Regulation of caffeine-induced Ca2+ release by [Ca2+]ER. The ER was refilled by perfusing with medium containing 1 mM Ca2+ and then 1 μM histamine or different concentrations of caffeine were added, as indicated. In the experiment shown in c, cells were incubated with 10 μM BAPTA-AM during aequorin reconstitution in order to load the cytosol with this Ca2+ chelator. Other details are as in Fig. 1.
Figure 5
Figure 5
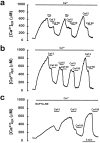
Activation of CICR by the Ca2+ entry elicited by high K+-induced cell depolarization. The ER was refilled by perfusing medium containing 1 mM Ca2+. Then, standard medium containing 70 mM KCl was perfused as indicated. In c, 10 μM CPA was added as indicated with or without high K+ medium. In this panel, the [Ca2+]ER scale has been normalized as percentage of the maximum [Ca2+]ER level in order to facilitate comparison. In the presence of CPA and high K+ medium the initial rate of [Ca2+]ER decrease is much higher that with CPA alone, but once [Ca2+]ER is below 80% of the initial level, the rates of release in both cases turn similar and can be nearly superimposed. In d, 1 mM caffeine was also added as indicated. Other details are as in Fig. 1.
Figure 6
Figure 6
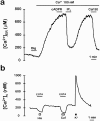
(a) Effects of cADPR, InsP3, and caffeine on [Ca2+]ER in permeabilized cells. Cells were permeabilized by perfusion with 20 μM digitonin for 1 min as indicated. Then the ER was refilled by perfusion with medium containing 100 nM Ca2+ (buffered with EGTA). Finally, either 5 μM cADPR, 2 μM InsP3, or 50 mM caffeine were perfused as indicated. (b) Effect of preincubation with 20 nM thapsigargin on the [Ca2+]c responses to histamine, caffeine, and high K+ medium. Cells were loaded with fura-2, preincubated for 20 min with 20 nM thapsigargin, and then suspended in standard medium containing 1 mM CaCl2. Then, either 10 μM histamine, 50 mM caffeine, or standard medium containing 1 mM CaCl2 and 70 mM KCl were perfused as indicated. Both histamine and caffeine were perfused in Ca2+-free medium (containing 100 μM EGTA) to avoid Ca2+ entry. Perfusion with Ca2+-free medium was started 15 s before and continued for 15 s after stimulation with histamine or caffeine. The trace shown corresponds to the average of 42 cells present in the microscope field. Other details are as in Fig. 1.
Figure 7
Figure 7
Effects of ryanodine and either depolarization with high K+ medium (a), field electric stimulation (b), or histamine (c) on the [Ca2+]c responses induced by caffeine. Cells were loaded with fura-2 and placed under the microscope in standard medium containing 1 mM CaCl2. Then, different stimuli were given as indicated: different concentrations of caffeine (Caf, in mM), medium containing 70 mM KCl (K+), 10 μM histamine (His), 10 μM ryanodine (Ry), or field electric stimulation (E.S. 10 Hz for 10 s, arrows). Caffeine and histamine were added in Ca2+-free medium (containing 100 μM EGTA). Perfusion with Ca2+ free medium was started 15 s before and continued for 15 s after the stimuli. Transition from Ca2+-containing to Ca2+-free medium sometimes produced a small [Ca2+]c peak. The traces shown are the average of 36 (a), 49 (b), and 61 (c) cells present in the microscope field.
Figure 8
Figure 8
Effect of [Ca2+]ER on CICR induced by depolarization with high K+. Cells depleted of Ca2+ and reconstituted with coelenterazine n were placed in the luminometer in 0.5 mM EGTA containing standard medium. Then, 10-s pulses of medium containing 70 mM KCl and 2 mM CaCl2 were given as indicated and 0.5 mM EGTA containing standard medium was perfused during the intervals. After five pulses, Ca2+-containing (1 mM) medium was perfused for 3 min to refill the ER, and then the previous protocol was started again.
Figure 9
Figure 9
Confocal imaging of the propagation of the [Ca2+]c signal induced by cell depolarization. (a) Mean image from 34 line-scan fluorescence images representing F/F0 (ratio between fluo-3 fluorescence at a certain time and before stimulation, an index for [Ca2+]c) in control cells stimulated by a 100-ms depolarizing pulse from a holding potential of −70 mV to 10 mV (top). (b) Mean image from 21 records of ryanodine-treated cells displayed as in panel a. Before starting the experiment, cells were exposed three times to a 10 mM caffeine + 10 μM ryanodine-containing Krebs-Hepes solution. After that, cells were maintained in 10 μM ryanodine during the whole experiment. c–e show the distribution with the distance to the plasma membrane of the maximum F/F0 levels (c), the rate of rise of fluo-3 fluorescence, measured as the slopes calculated from the first 10 ms of the signal rising (d), and the time (t1.1) from the initiation of the pulse to the moment in which a value F/F0 ≥ 1.1 (taken as an arbitrary threshold) was reached (e).

References

    1. Albillos A, Garcia AG, Olivera B, Gandia L. Re-evaluation of the P/Q Ca2+ channel components of Ba2+ currents in bovine chromaffin cells superfused with solutions containing low and high Ba2+concentrations. Pflug Arch Eur J Physiol. 1996;432:1030–1038. - PubMed
    1. Alonso MT, Barrero MJ, Carnicero E, Montero M, Garcia-Sancho J, Alvarez J. Functional measurements of [Ca2+] in the endoplasmic reticulum using a herpes virus to deliver targeted aequorin. Cell Calcium. 1998;24:87–96. - PubMed
    1. Barrero MJ, Montero M, Alvarez J. Dynamics of [Ca2+] in the endoplasmic reticulum and cytoplasm of intact HeLa cells. A comparative study. J Biol Chem. 1997;272:27694–27699. - PubMed
    1. Berridge MJ. Inositol trisphosphate and calcium signalling. Nature. 1993;361:315–325. - PubMed
    1. Berridge MJ. Neuronal calcium signalling. Neuron. 1998;21:13–26. - PubMed

Publication types