

Review
doi: 10.1128/AAC.43.2.199.
Genetic methods for assessing antimicrobial resistance
Affiliations
- PMID: 9925507
- PMCID: PMC89052
- DOI: 10.1128/AAC.43.2.199
Item in Clipboard
Review
Genetic methods for assessing antimicrobial resistance
Antimicrob Agents Chemother.
1999 Feb.
No abstract available
Figures
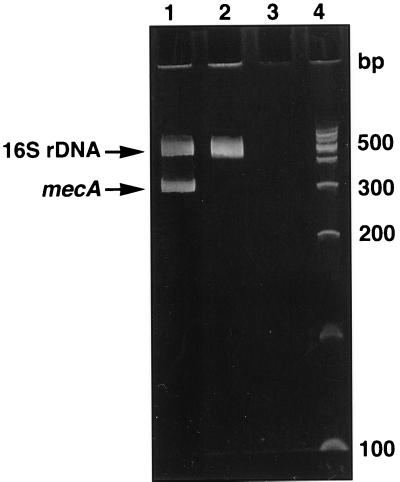
Multiplex PCR and gel electrophoresis for identifying the mecA gene in Staphylococcus spp. Two distinct PCRs were performed: one amplified a portion of 16S rDNA unique to Staphylococcus spp., and the second amplified a segment of the mecA gene. Lane 1, strain of methicillin-resistance S. aureus; electrophoretic bands of the appropriate size appear for the 16S rDNA and mecA. Lane 2, methicillin-susceptible S. aureus; an electrophoretic band for 16S rDNA is present but there is no band for mecA. Lane 3, negative control (reagents only), lane 4, DNA fragment standards. bp, base pair.
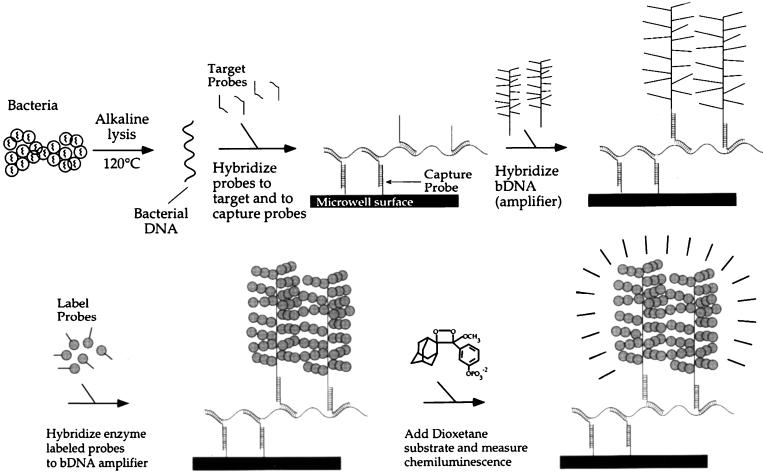
bDNA method for identifying the mecA gene in Staphylococcus spp. A generic representation of the bDNA method, which has been used for detection of the mecA gene, is shown. DNA is released from staphylococcal cells and hybridized to both capture probes and target probes. bDNA molecules (amplifiers) are then hybridized to target probes. Enzyme-labeled probes are subsequently hybridized to the bDNA amplifier. A chemiluminsescent substrate, dioxetone, is added and emitted light is measured. (Adapted with permission from Chiron Diagnostics, Norwood, Mass.)
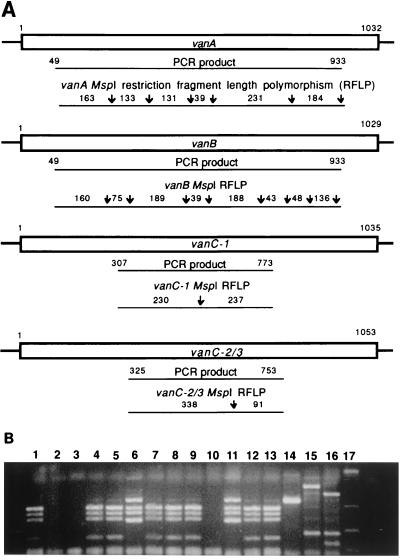
PCR-RFLP analysis for identifying genes associated with vancomycin resistance in Enterococcus spp. (A) Six primers are used in a multiplex reaction to generate four PCR products. Restriction fragment lengths predicted for vancomycin resistance genes vanA, vanB, vanC-1, and vanC-2/3 with the restriction enzyme (endonuclease) MspI are shown. (B) RFLP electrophoretic patterns obtained for various control strains and clinical isolates of Enterococcus sp. containing vancomycin resistance-associated genes. Lanes 2, 3, and 10, no restriction fragments produced; lanes 6 and 11, vanA pattern, lanes 1,4, 5, 7–9, 12, and 13 vanB patterns: lane 14, vanC-1 pattern; lane 15, vanC-2 pattern; lane 16, restriction fragment pattern unrelated to vanA, vanB, and vanC; lane 17, DNA fragment standards. (Adapted with permission from Patel et al. [46].)
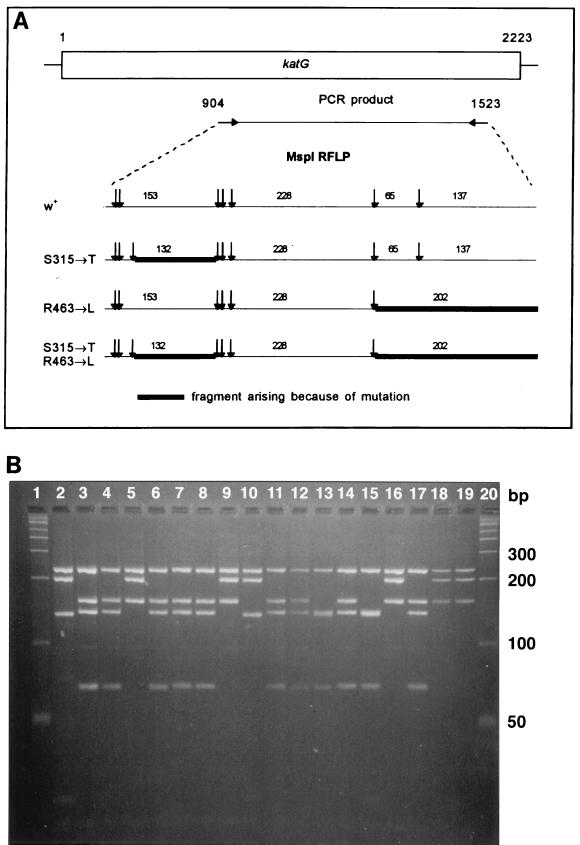
PCR-RFLP analysis for identifying isoniazid resistance-associated mutations in M. tuberculosis. (A) Restriction fragment length predicted for two mutations (codons 315 [serine → threonine] and 463 [arginine → leucine]) in the katG gene of M. tuberculosis with the restriction enzyme MspI. These mutations are associated with high- and low-level isoniazid resistance, respectively. W+, wild type. (Adapted with permission from Uhl et al. [74].) (B) RFLP electrophoresis patterns obtained for M. tuberculosis strains. Lanes 1 and 20, DNA fragment standards; lanes 2 and 10, DNA from strains with both the R463L and S315T mutations; lanes 5, 9, 16, 18, and 19, DNA from strains with the R463L mutation only; lanes 13 and 15, DNA from strains with the S315T mutation only. The remaining lanes have neither of these mutations. bp, base pair. (Adapted with permission from J. Uhl et al. [74].)
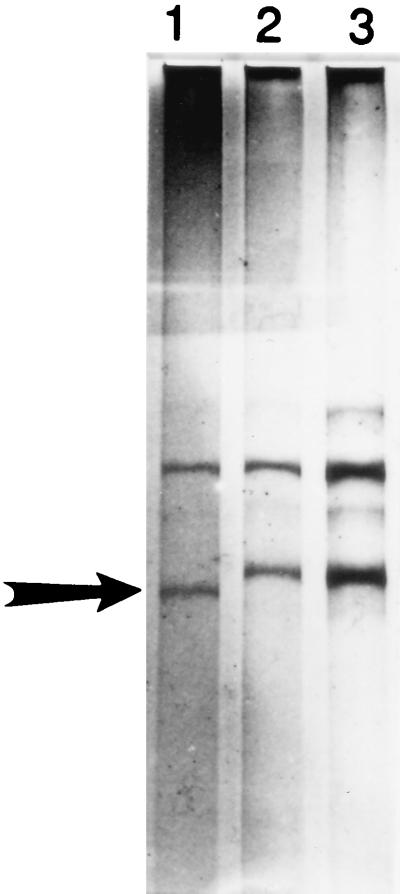
PCR-SSCP analysis to identify isoniazid resistance-associated mutations in M. tuberculosis. Representative PCR-SSCP results for three M. tuberculosis strains, one clinical strain with the R463L mutation (lane 1), one clinical strain with the wild-type codon 463 (R463) (lane 2), and the control strain H37Rv also containing the wild-type codon 463 (R463) (lane 3). The arrows indicates the band position corresponding to the R463L mutation. (Adapted with permission from Temesgen et al. [69].)
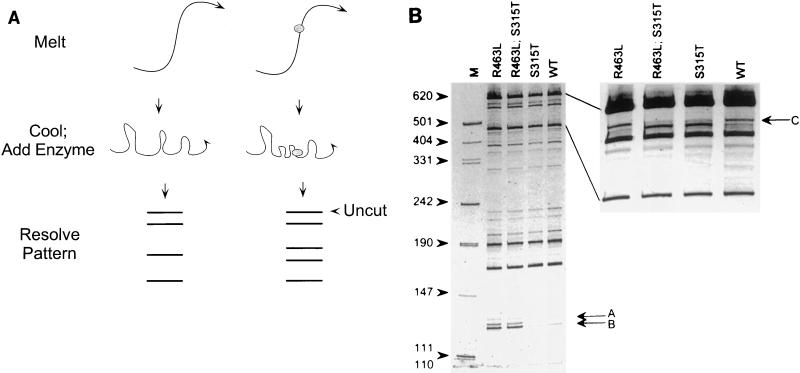
PCR-CFLP for identifying isoniazid resistance-associated mutations in M. tuberculosis. (A) Schematic representation of steps of CFLP pattern generation. Labeled fragments of DNA are heated to separate complementary strands. When the samples are cooled, the single strands of DNA assume folded hairpin-like structures; subtle differences in the sequence of the fragments can cause formation of different structures. The Cleavase I enzyme cleaves at the 5′ side of these structures, at the junction between duplexed and single-stranded regions. Separation and detection of the resulting fragments create signature banding patterns that can be compared to detect differences between the test molecules. (Adapted with permission from Brow et al. [5].) (B) Identification and positioning of mutations associated with isoniazid resistance in M. tuberculosis. For the gel on the left, amplicons generated with a 5′ labeled primer and an unlabeled primer were heat denatured for 15 s, rapidly cooled to 60°C, and digested with 25 U of Cleavase I for 2 min. The results are shown, with M indicating DNA size markers. Variant bands distinguishing mutant from wild-type (WT) DNA are marked A and B. Shown on the right is a second gel electrophoresis which was performed to expand the 500- to 600-nt region. Bands C in the wild type and the R463L mutant are similar, while the same band migrates faster in variants containing the S315T mutation. (Adapted with permission from Brow et al. [5].)

PCR-nonisotopic RNase cleavage assay. Commercially available as the Mutation Screener assay (Ambion, Inc.) the PCR-nonisotopic RNase cleavage assay is based on the ability to selectively cleave unpaired bases in RNA/RNA duplexes. Duplex RNA is transcribed from PCR products generated with primers containing opposing phage RNA polymerase promoters (T7/T7 or T7/Sp6). Following hybridization and RNase treatment, the RNA/RNA cleavage products are analyzed by nondenaturing gel electrophoresis and detected by ethidium bromide staining. In the example shown, mismatches occur due to an opposing uracil (U) and guanine (G) and an opposing cystosine (C) and adenine (A) with the adenine representing a point mutation in the test strain. (Adapted with permission from M. Goldrick, Ambion, Inc.)
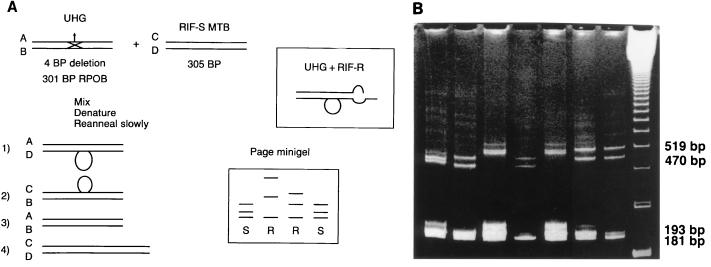
PCR-heteroduplex analysis to identify mutations associated with rifampin resistance in M. tuberculosis. (A) Hypothetical example of the universal heteroduplex generator technique. Different bands are produced in the polyacrylamide gel electrophoresis minigel depending on whether the test strain is susceptible or resistant to rifampin. UHG, universal heteroduplex generator; RIF-S, rifampin-susceptible test strain; RIF-R, rifampin-resistant test strain; BP, base pair; ROPβ, RNA polymerase β subunit gene. (Adapted with permission from D. Williams.) (B) In this example, a heteroduplex generator is used which contains four 3-bp deletions and three 2-bp substitutions. The presence of rifampin-susceptible M. tuberculosis is indicated by a four-band pattern. Two homoduplexes migrate in the gel at the equivalence of 181 (the universal heteroduplex generator double-stranded DNA) and 193 bp (the test sample PCR- generated double-stranded DNA). Two heteroduplexes migrate at the equivalence of 470 and 519 bp (each a hybrid of complementary strands of one strand of DNA from the heterodulex generator and on strand from the test sample DNA). The first five lanes (from left to right) contain rifampin-resistant strains, the next two lanes contain rifampin-susceptible strains, and the last lane contains molecular weight standards. (Adapted with permission from D. Williams.)
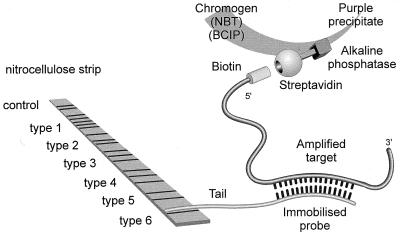
PCR-LiPA. Biotinylated PCR fragments are hybridized to a selection of highly specific probes immobilized on a nitrocellulose strip. The biotin group in the hybridization complex is revealed by incubation with a streptavidin-alkaline phosphatase complex and the chromogen compounds 5-bromo-4-chloro-3-indolylphosphate (BCIP) and nitroblue tetrazolium (NBT). (Figure provided by F. Shapiro, Innogenetics.)
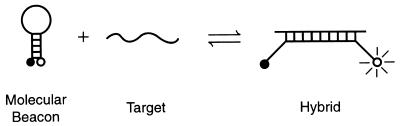
Principles of molecular beacons. The molecular beacon in its hairpin form shown on the left is nonfluorescent because the stem hybrid keeps the fluorophore close to the quencher. When the probe sequence in the loop hybridizes to its target, forming a rigid double helix, a conformational reorganization occurs that separates the quencher from the fluorophore, restoring fluorescence. (Adapted with permission from Tyagi et al. [71].)
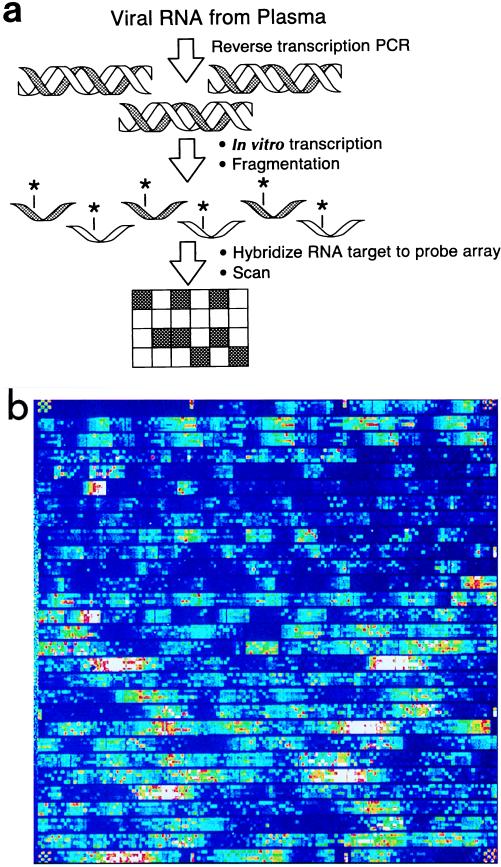
Silicon microchip assay for detection of mutations in the HIV genome associated with resistance to reverse transcriptase or protease inhibitors. (a) A schematic of the commercially available GeneChip HIV PRT Assay (Affymetrix, Santa Clara, Calif.) is shown. Viral RNA is reversed transcribed to cDNA which is then transcribed into RNA, labeled, and fragmented. These labeled RNA fragments are then hybridized to complementary probes synthesized directly onto a microchip. The hybridized array is then scanned to detect positive hybridization signals in the form of emitted light. (Adapted with permission from L. Constantine, Affymetrix.) (b) Example of DNA microchip array image. (Adapted with permission from L. Constantine, Affymetrix.)
References
-
- Anonymous. Methods of creating DNA molecules. In: Watson J D, Gilman M, Witkowski J, Moller Z, editors. Recombinant DNA. New York, N.Y: Scientific American Books; 1992. pp. 63–75.
-
- Arlet G, Brami G, Décrè D, Flippo A, Gaillot O, Lagrange P H, Philippon A. Molecular characterization by PCR-restriction fragmented length polymorphism of TEM β-lactamases. FEMS Microbiol Let. 1995;134:203–208. - PubMed
-
- Ausubel F M, Albright L M. DNA sequencing. In: Ausubel F, Brent R, Kingston R, Moore D, Seidman J G, Smith J A, Struhl K, editors. Current protocols in molecular biology, suppl. 23. Boston, Mass: John Wiley and Sons; 1998. pp. 7.0.1–7.7.7.23.
-
- Bignardi G E, Woodford N, Chapman A, Johnson A P, Speller D C E. Detection of the mecA gene and phenotypic detection of resistance in Staphylococcus aureus isolates with borderline or low-level methicillin resistance. J Antimicrob Chemother. 1996;37:53–63. - PubMed
-
- Brow M A, Oldenburg M C, Lyamichev V, Heisler L M, Lyamichera N, Hall J G, Eagen N J, Olive D M, Smith L M, Fors L, Dahlberg J E. Differentiation of bacterial 16S rRNA genes and intergenic regions and Mycobacterium tuberculosis katG genes by structure-specific endonuclease cleavage. J Clin Microbiol. 1996;34:2139–3132. - PMC - PubMed
Publication types
MeSH terms
LinkOut - more resources
Full Text Sources
Other Literature Sources
Medical
